Social Media Marketing
Social Media In 2013 [INFOGRAPHIC]
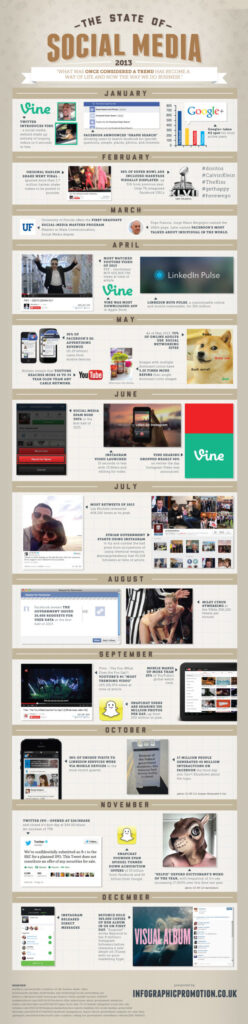
This infographic illustrates significant events in social media during 2013.
Read MoreDaily Tweet Frequency OF Top Companies, Q4 2013 [CHART]
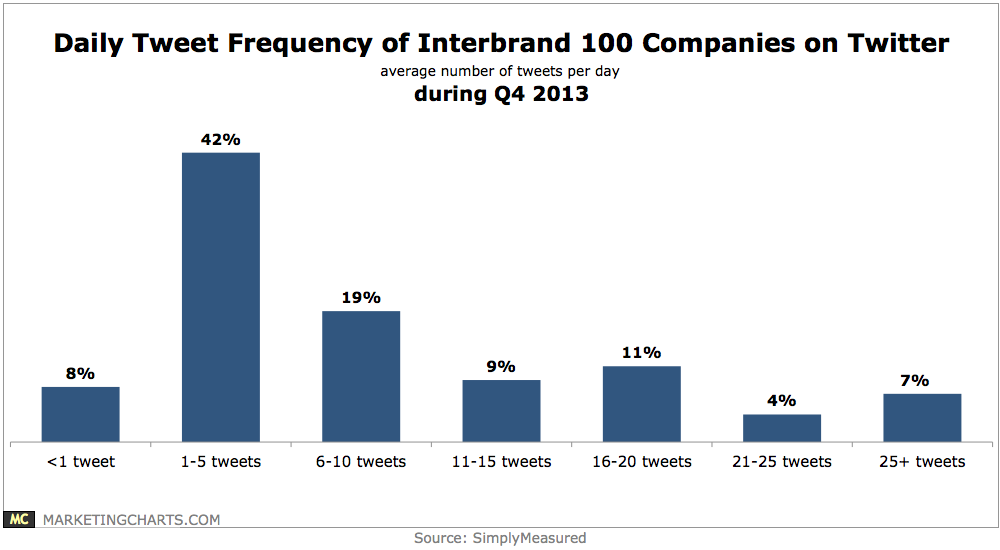
98 of the Interbrand 100 brands were active on Twitter as of Q4 2013 and 92% of those tweeted at least once per day during the period.
Read MoreEnterprise Marketers' Changing Media Mix For Targeting SMBs, January 2014 [CHART]
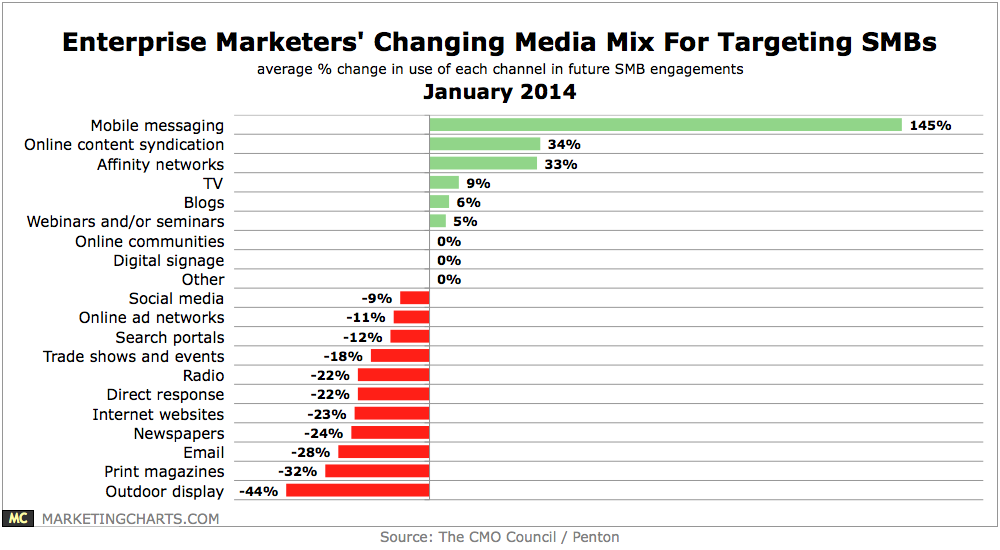
Enterprise-level marketers who sell to the SMB market are planning to make interesting changes to their media mix.
Read MoreFacebook Ad Performance Trends, Q4 2013 [CHART]
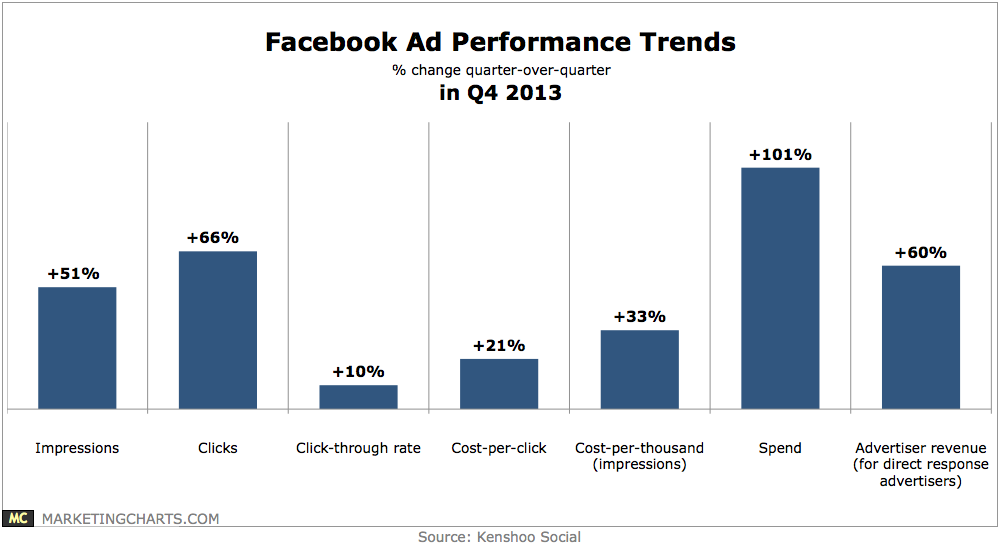
Facebook ad click-through rates grew by 10% quarter-over-quarter (Q-o-Q) in Q4.
Read MoreSocial Search [INFOGRAPHIC]
This infographic by Prestige Marketing illustrates some trends in social search.
Read MoreA Year In Vines [PRESENTATION]
A retrospective of Vine’s first year.
Read MoreDesktop-Only Social Network Visitors, 2013 [CHART]
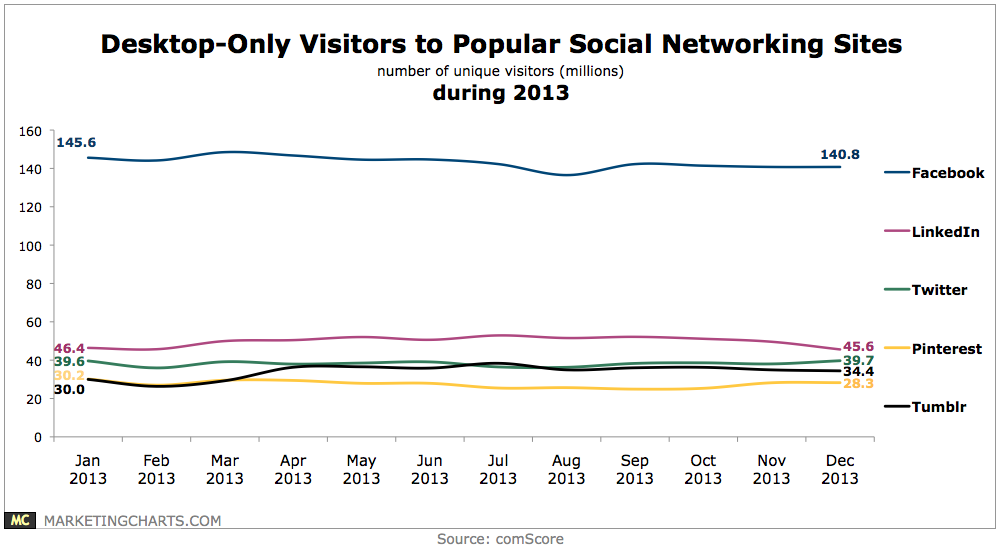
Facebook remains the leader in desktop-only visitors by a large margin, although its numbers appeared to dip slightly during the year.
Read MoreSpeed Up WordPress [INFOGRAPHIC]
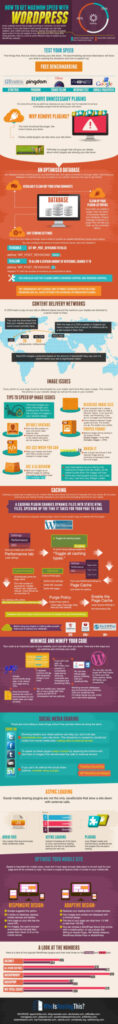
This infographic by WhoIsHostingThis illustrates methods for speeding up your WordPress blog.
Read MoreConsumers & Brand Engagement By Generation, January 2014 [CHART]
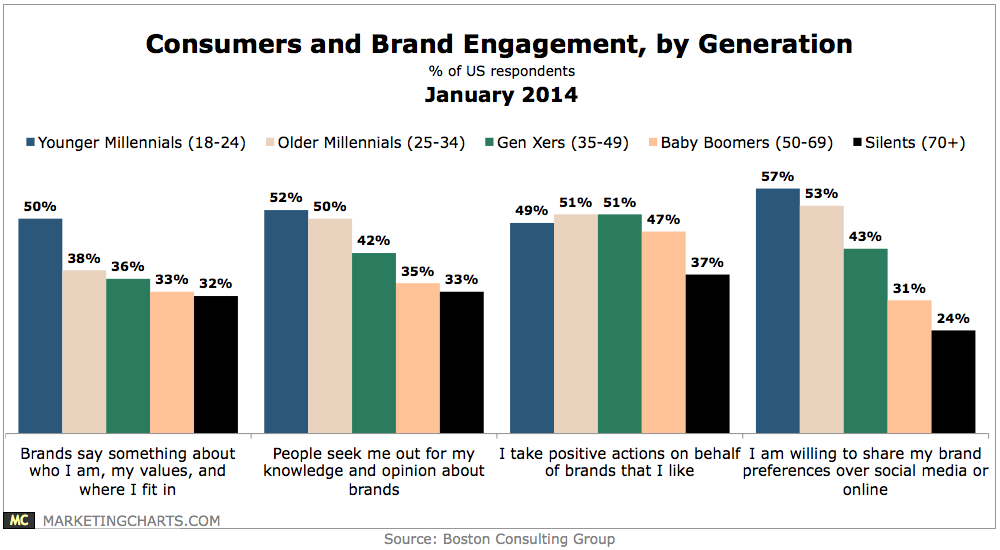
Roughly half of younger US Millennials (18-24) agree that brands say something about who they are, what their values are, and where they fit in.
Read MoreOverlap Between TV & Brand Tweeters, January 2014 [CHART]
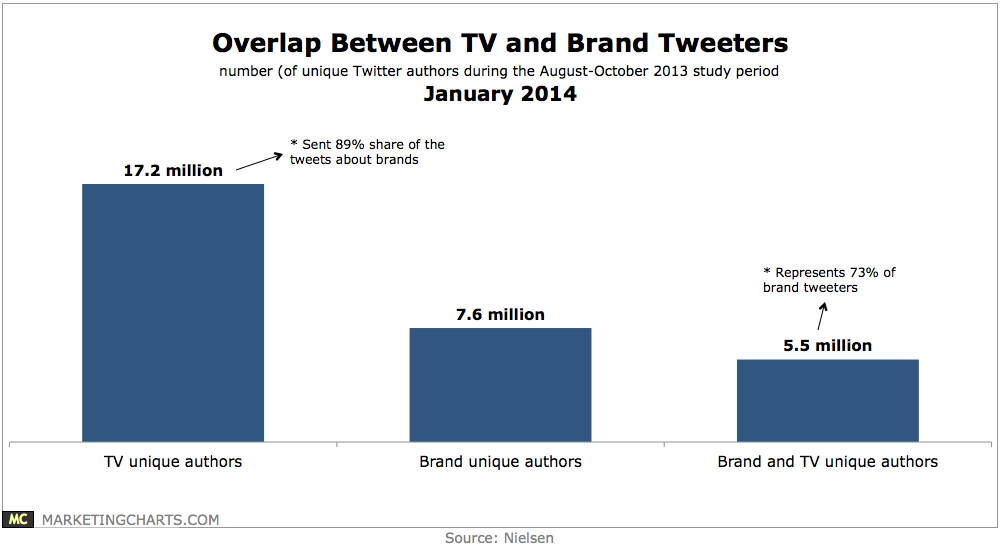
TV tweeters make up 73% of the number of people who tweeted about brands during the study period.
Read More