Social Media Marketing
Online Video Discovery Methods, January 2014 [CHART]
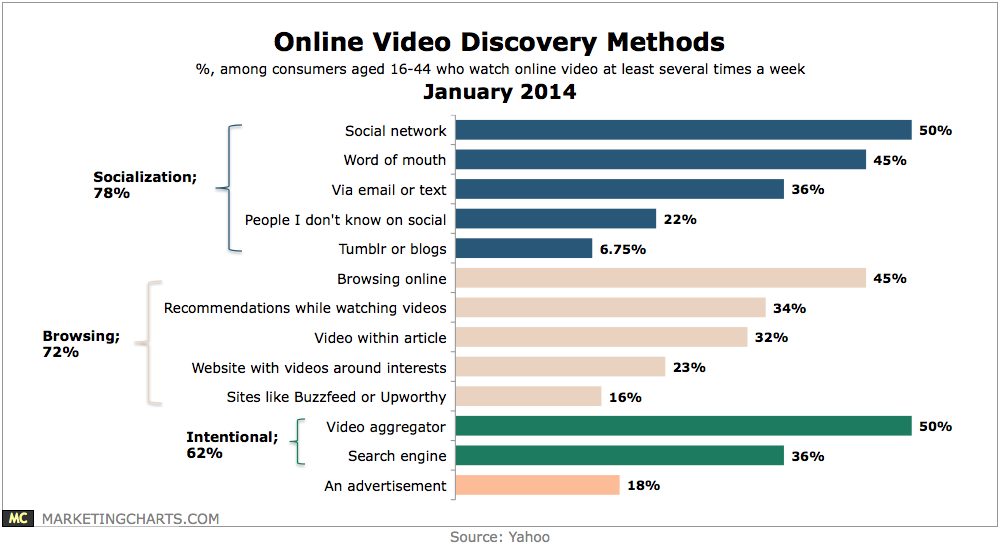
Almost 8 in 10 find videos through social means, with 50% finding them through their social network and 45% from word-of-mouth.
Read MoreFacebook Mobile Users & Ad Revenues, Q3 2012 – Q4 2013 [CHART]
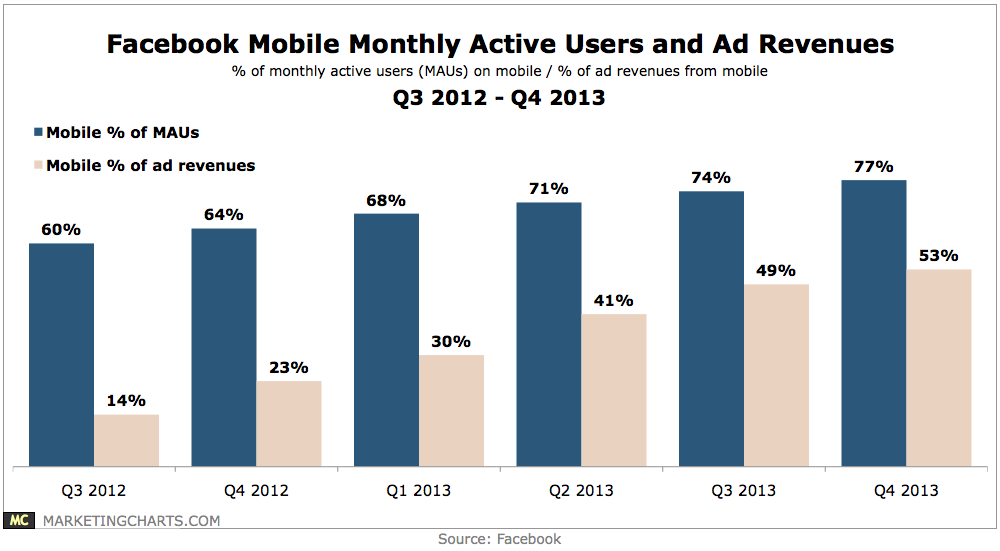
Facebook has crossed a threshold of sorts, with mobile now comprising a majority 53% share of its growing ad revenues.
Read MoreQuantified Self Universe [VENN DIAGRAM]
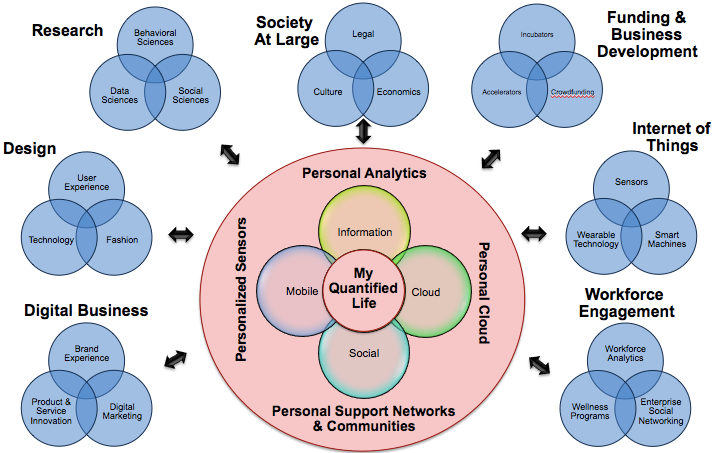
As quantified self becomes more established in the market, its intersection with mobility, social networking, and ethnography is one of the most intriguing areas of coverage.
Read MoreSocial TV & Super Bowl Ads [INFOGRAPHIC]
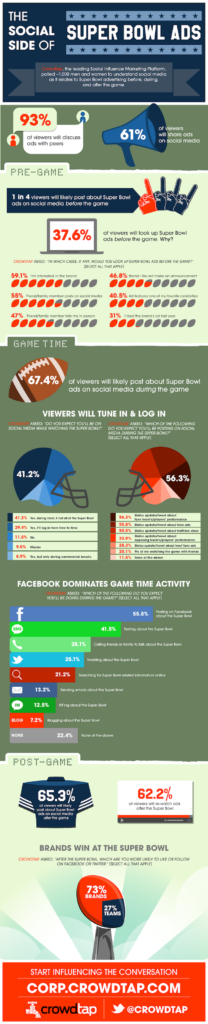
This infographic from Crowdtap illustrates the social side of Super Bowl ads.
Read MoreSocial Referral Traffic Trends, September 2012 – December 2013 [CHART]
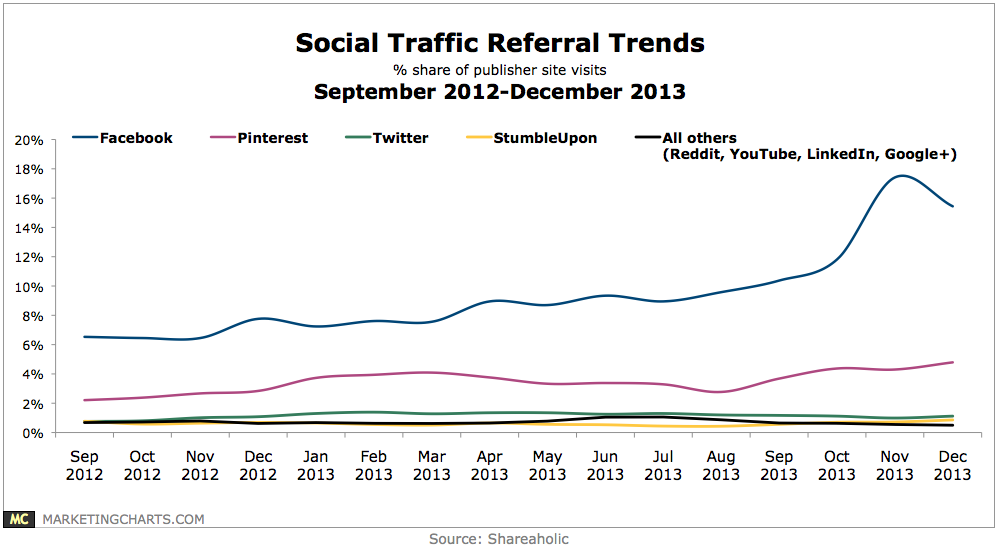
While Facebook’s share of site visits retreated a little after a surge in November, it remains the comfortable leader, ending 2013 far ahead of its competitors.
Read MoreMost Effective Issue Resolution Methods, According To Customers – January 2014 [CHART]
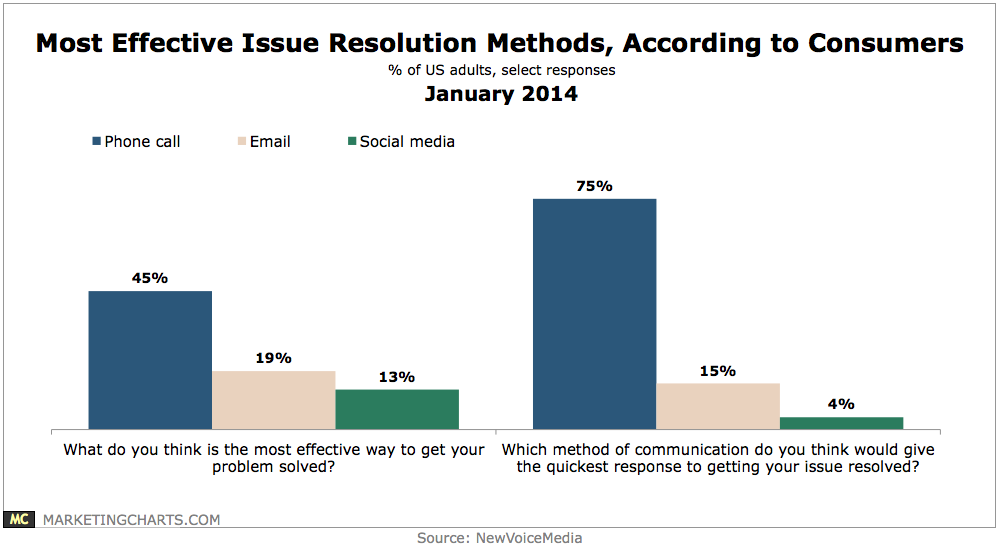
Some 45% of respondents believe that calling a company is the most effective way to get their problem solved, compared to 19% who felt that way about email and 13% about social media channels.
Read MoreWhere Retailers Plan To Invest In Loyalty Marketing, April 2013 [CHART]
Retailers in North America were eyeing up increased investment in a host of loyalty marketing-related areas.
Read MoreSocial Media Response Rates By Industry, Q3 2013 [TABLE]
A breakdown of social media response times and rates by industry found that government companies had the longest response time—14.5 hours—and a response rate of just 17%.
Read MoreThe Personality Types Of Popular Facebook Pages [INFOGRAPHIC]
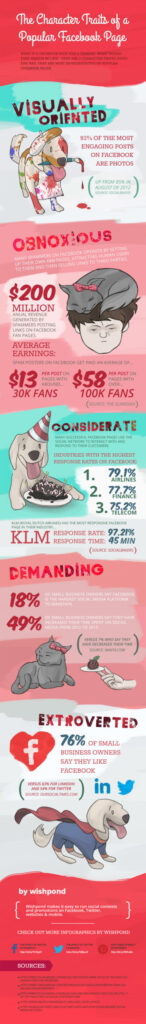
This infographic by Wishpond illustrates popular Facebook pages by personality type.
Read MoreSocial Revenue Per-Visit, Q4 2012 vs Q4 2013 [CHART]
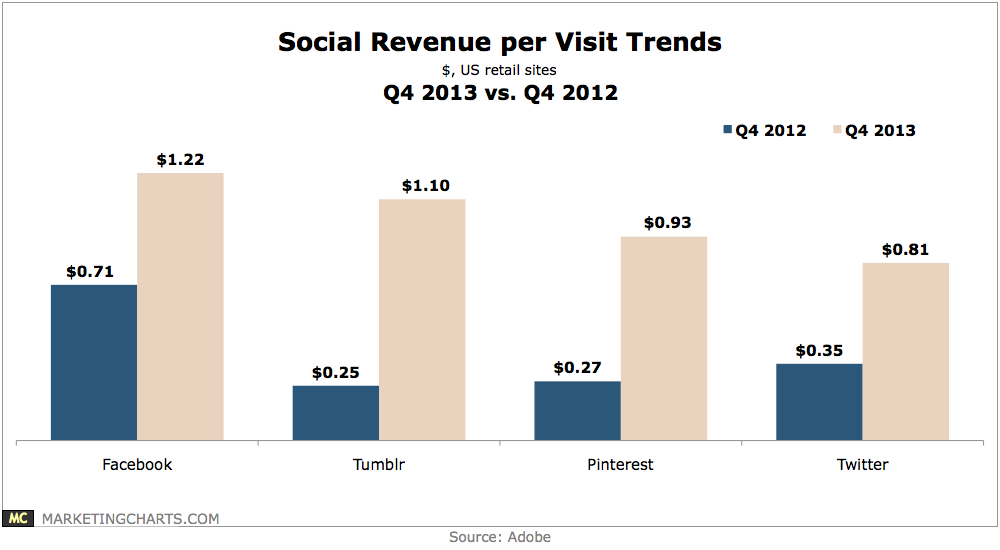
None of the major platforms’ revenue-per-visit (RPV) grew quite as quickly on a year-over-year basis as Tumblr: the network’s RPV shot up by 340% to $1.10 in Q4 2013.
Read More