Social Media Marketing
US Parents Who Follow Brands On Social Networks, January 2014 [CHART]
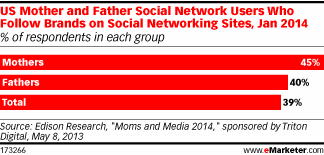
45% of US mother social networkers with children younger than 18 in the household followed brands on social sites.
Read MoreUS Social Ad Revenues – Desktop vs Mobile, 2013-2018 [CHART]
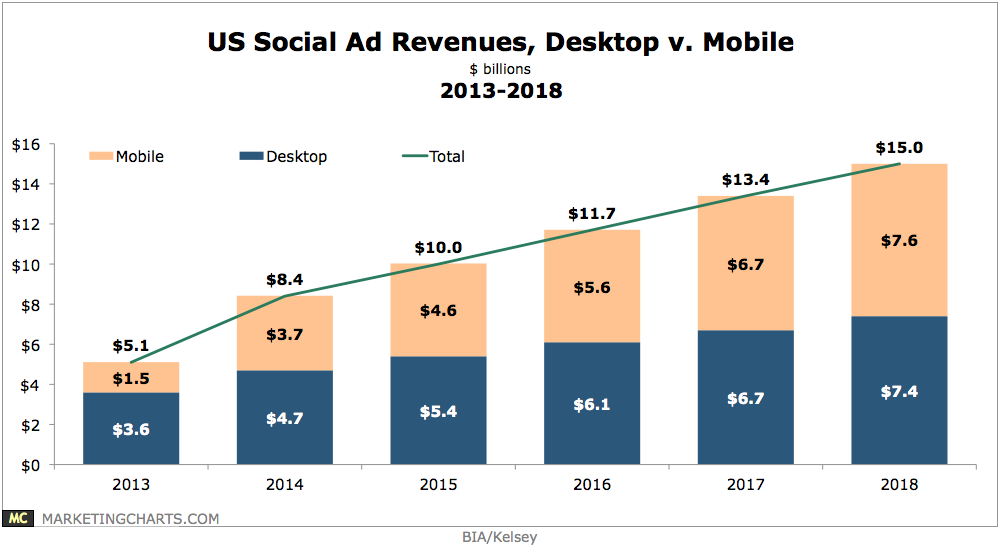
Social mobile ad revenues in the US exceeded $1.5 billion last year, and will grow at a rapid 38.3% compound annual rate through 2018, when they will reach $7.6 billion.
Read MoreUS Social Ad Revenues – Display vs Native, 2013-2018 [CHART]
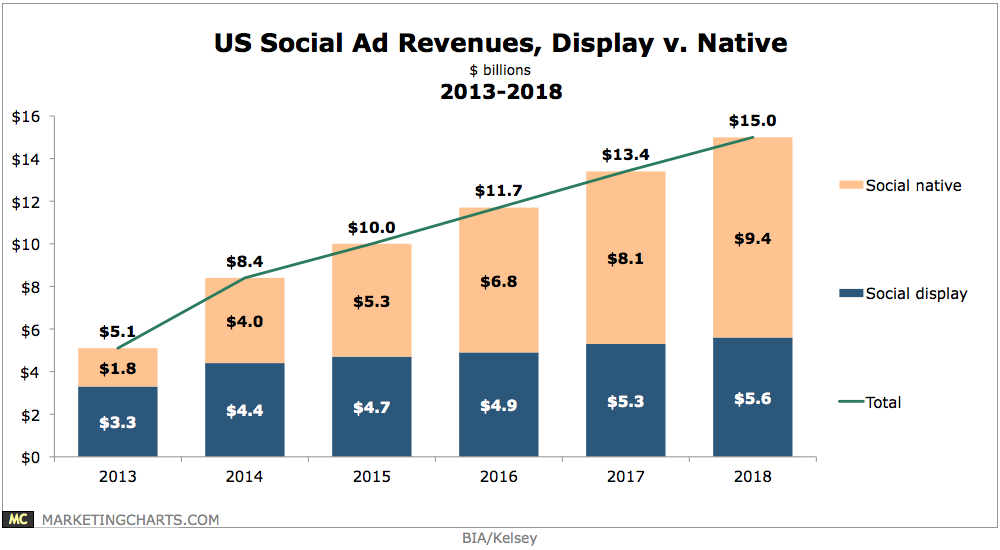
Native social ads are expected to overtake social display ads in revenue next year.
Read MoreUK Social TV Viewers By Demographic, September 2013 [TABLE]
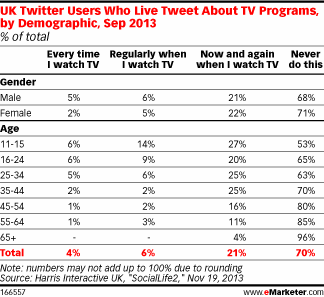
Nearly two-thirds of UK 16- to 24-year-olds who used Twitter said they never live tweeted about TV programs.
Read MoreUK Multitainment Use By Age, February 2014 [CHART]
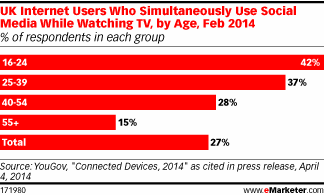
Social media usage while watching TV was still a minority activity among older teens and early 20-somethings in the UK.
Read MoreiOS Users' Mobile Site Engagement, February 2014 [CHART]
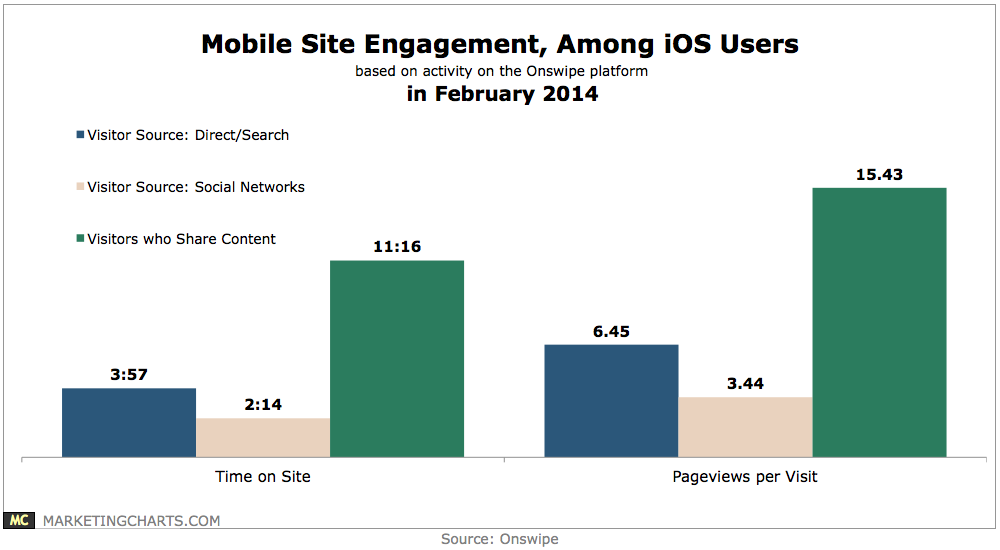
Direct and search-referred iOS visitors to mobile websites tend to be more engaged than those who are referred by social networks.
Read MoreTop Online Marketing Channels That Generated Orders, Q1 2013 & Q1 2014 [TABLE]
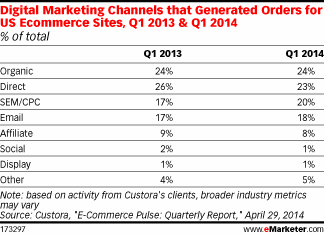
Social accounts for just 1% of US eCommerce orders in Q1 2014, tying display for the lowest share.
Read MorePercent Of eCommerce Customers Driven By Social, Q1 2014 [CHART]
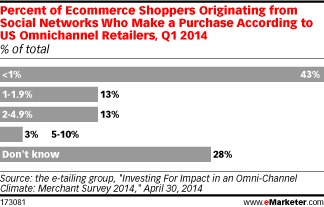
43% of US omnichannel retailers said less than 1% of online shoppers coming from a social network made a purchase while visiting the site.
Read MoreSocial Media Tools & Features Used By US Omnichannel Retailers, Q1 2014 [CHART]
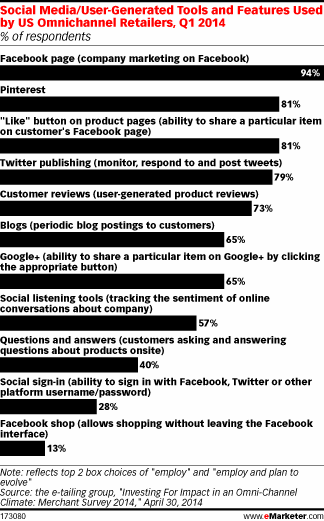
94% of US omnichannel retailers had a Facebook page, and 81% had a Like button on product pages, allowing customers to share a particular item of interest.
Read MoreTypes Of Ads Nordic Residents Most Trust, February 2014 [TABLE]
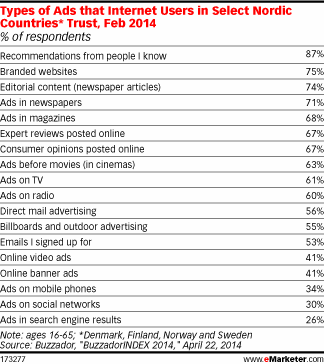
Around one-third said they trusted ads on mobile phones, and three in 10 said the same for those on social networks.
Read More