Social Media Advertising
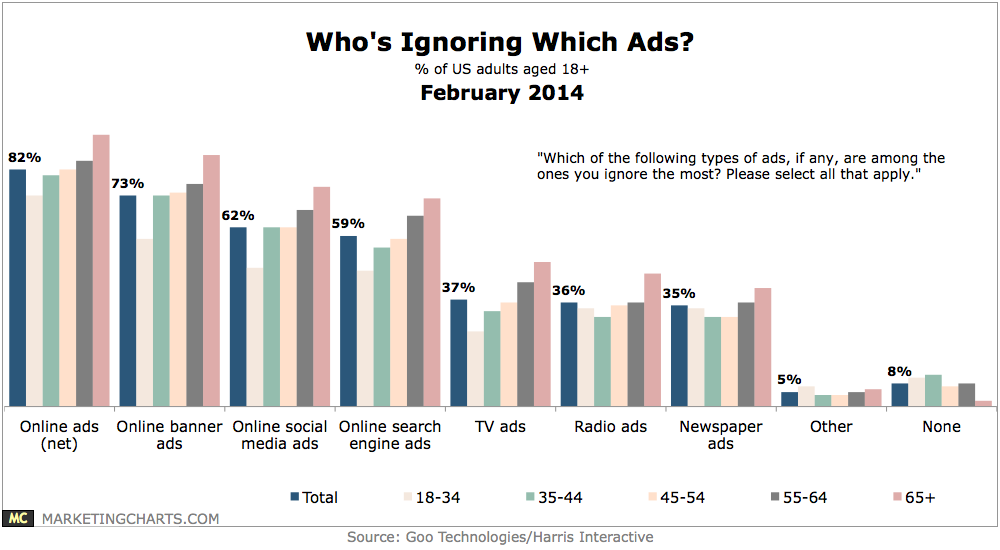
Ads People Most Ignore, February 2014 [CHART]
Online ads are ignored by the largest share of respondents (82%), with traditional media ads such as TV ads (37%), radio ads (36%), and newspaper ads (35%) a fair way behind.
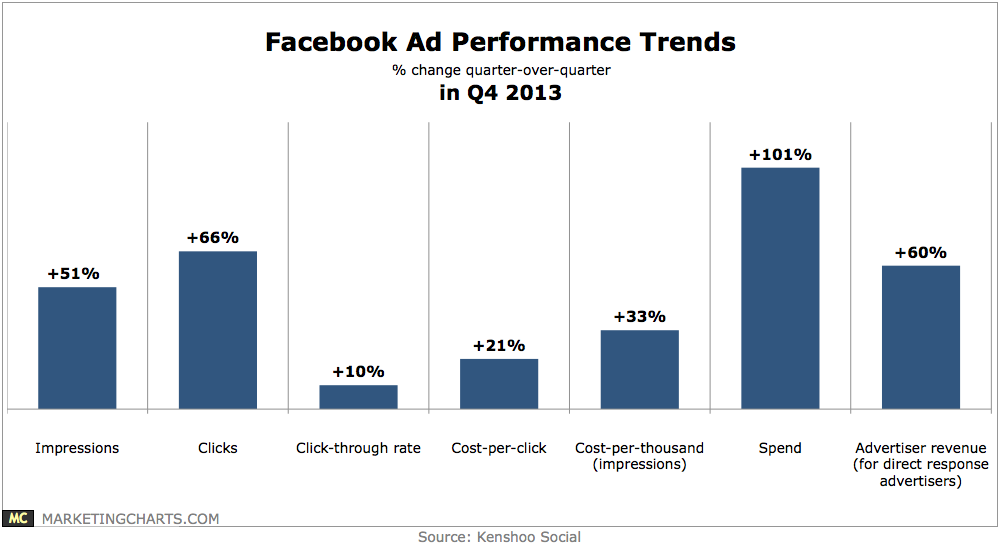
Read MoreFacebook Ad Performance Trends, Q4 2013 [CHART]
Facebook ad click-through rates grew by 10% quarter-over-quarter (Q-o-Q) in Q4.
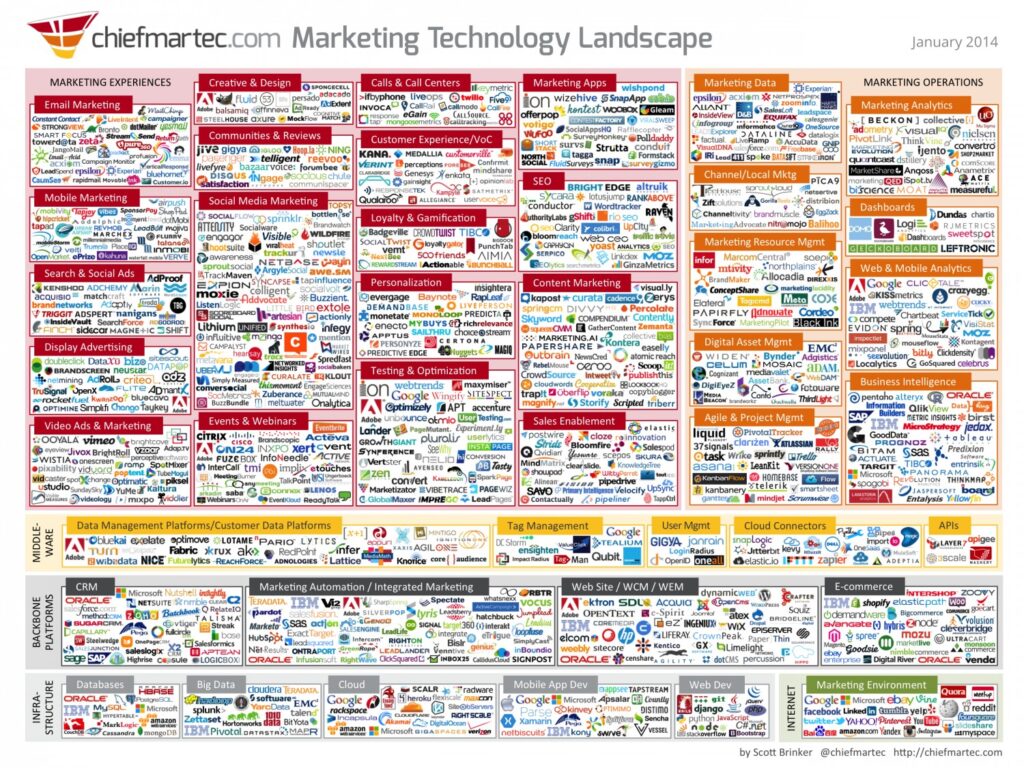
Read More2014 Marketing Technology Landscape [INFOGRAPHIC]
This infographic illustrates the marketing technology universe with 947 different companies that provide software for marketers.
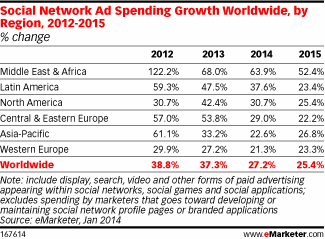
Read MoreGlobal Social Network Ad Spending Growth By Region, 2012-2015 [TABLE]
Overall, social network ad spending is growing most quickly in the Middle East and Africa.
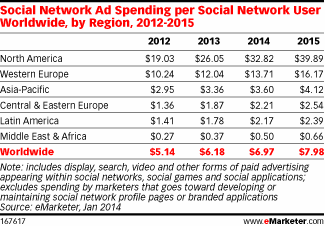
Read MoreGlobal Social Media Ad Spending Per Social Network User By Region, 2012-2015 [TABLE]
Advertisers will invest $32.82 on social network advertising per social network user in North America this year, up from just over $26 in 2013.
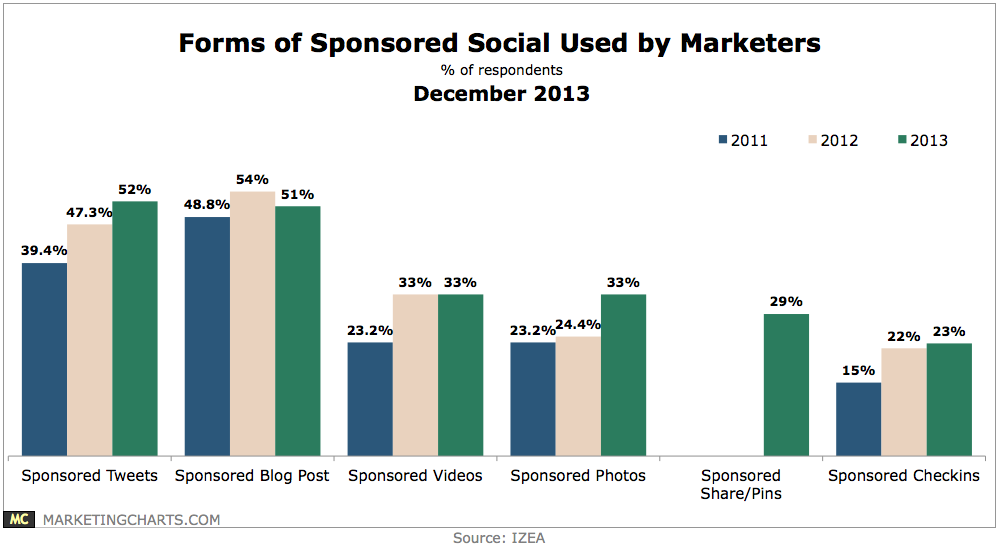
Read MoreTypes Of Sponsored Social Media Marketers Use, 2011-2013 [CHART]
A slight majority (52%) of marketers have used Sponsored Tweets, up from 47.3% last year and 39.4% in 2011.
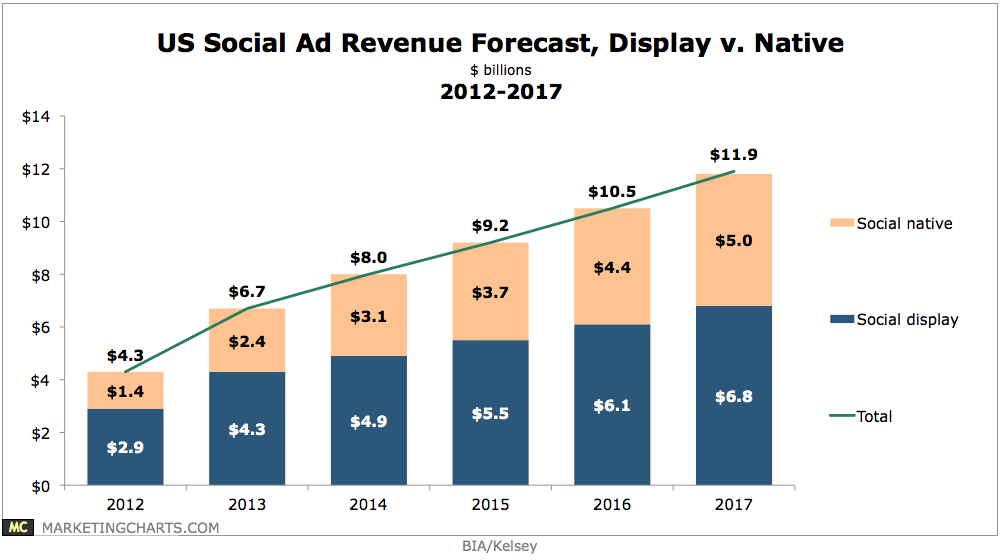
Read MoreUS Social Ad Revenue Forecast, Display vs Native 2012-2017 [CHART]
Native social ad revenues – primarily driven by Facebook’s Sponsored Stories and Twitter’s Promoted Tweets – will reach $5 billion in 2017, up from roughly $4.6 billion in the previous forecast.
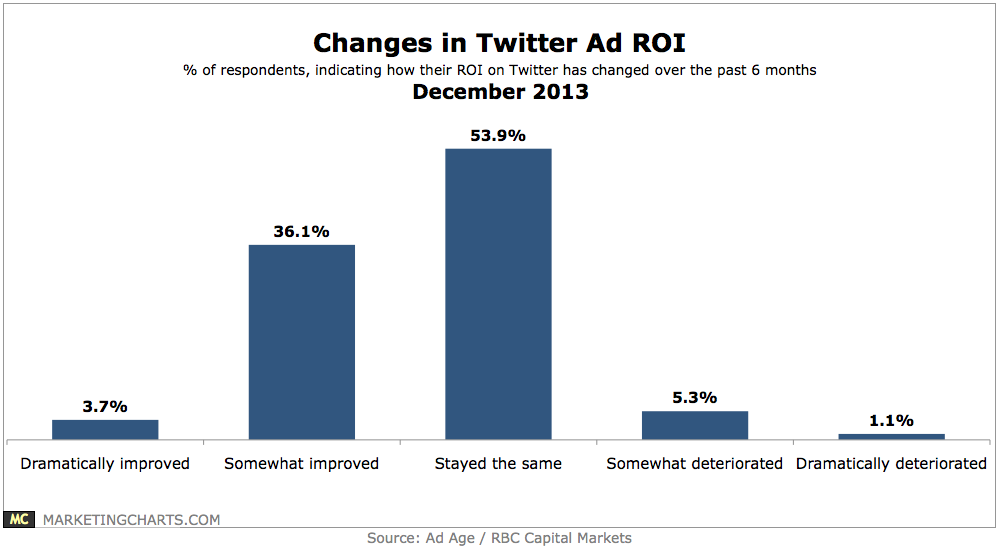
Read MoreChanges In Twitter Ad ROI, December 2013 [CHART]
Roughly 6 in 10 marketers advertising on Twitter expect their Twitter ad budgets to increase either significantly (12.1%) or modestly (47.1%) over the next year.
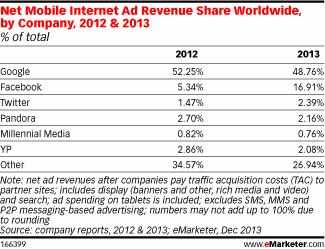
Read MoreGlobal Net Mobile Ad Revenue Share By Company, 2012 & 2013 [TABLE]
Globally, Google dominates the mobile ad landscape, with a 48.76% market share.
Read MoreNet US Mobile Ad Revenue Share By Company, 2012-2015 [TABLE]
Google and Facebook grabbed the greatest shares of net US mobile ad revenues, with Facebook jumping from 9.0% to 16.0% between 2012 and 2013.
Read More