Silent Generation
How People Watch Time-Shifted TV By Demographic, February 2013 [TABLE]
Nearly eight out of 10 US adult internet users watched TV on their own schedule.
Read MoreBinge TV Viewing By Generation & Gender, April 2013 [CHART]
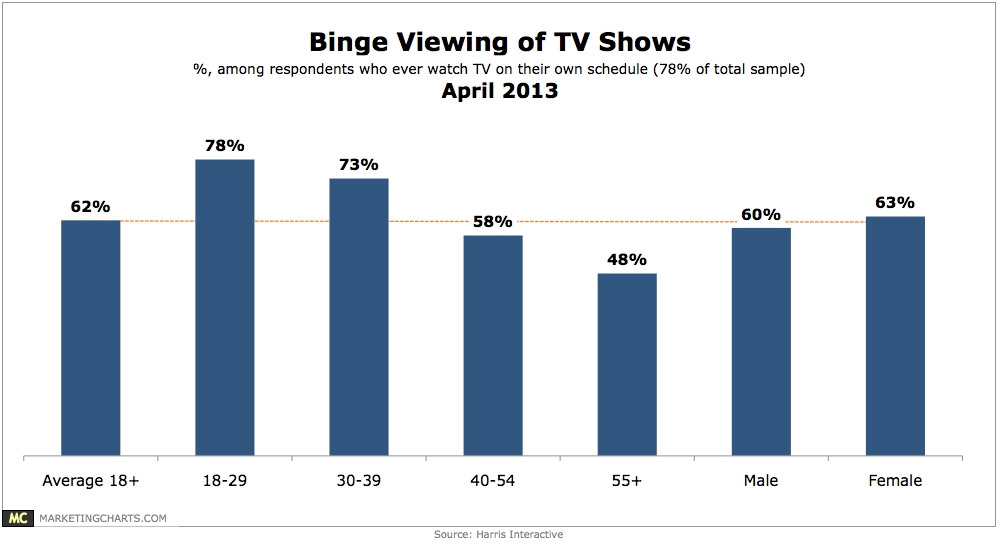
78% of Americans have watched TV on [their] own schedule and 62% of those have watched multiple episodes of a TV show at a time.
Read MoreAd Awareness By Generation & Context, April 2013 [CHART]
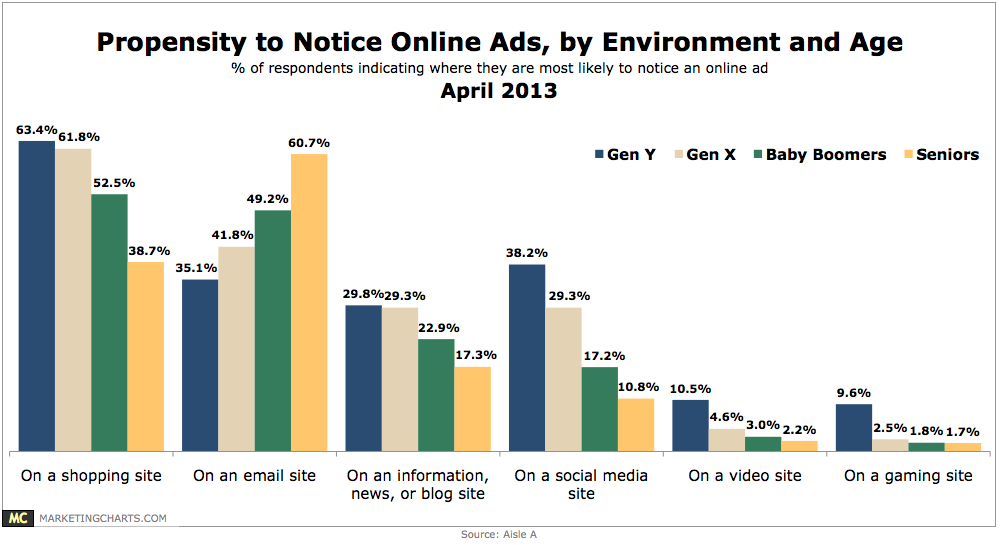
About half of consumers often (18.2%) or sometimes (33%) pay attention to online ads.
Read MoreHappiness By Generation, April 2013 [CHART]
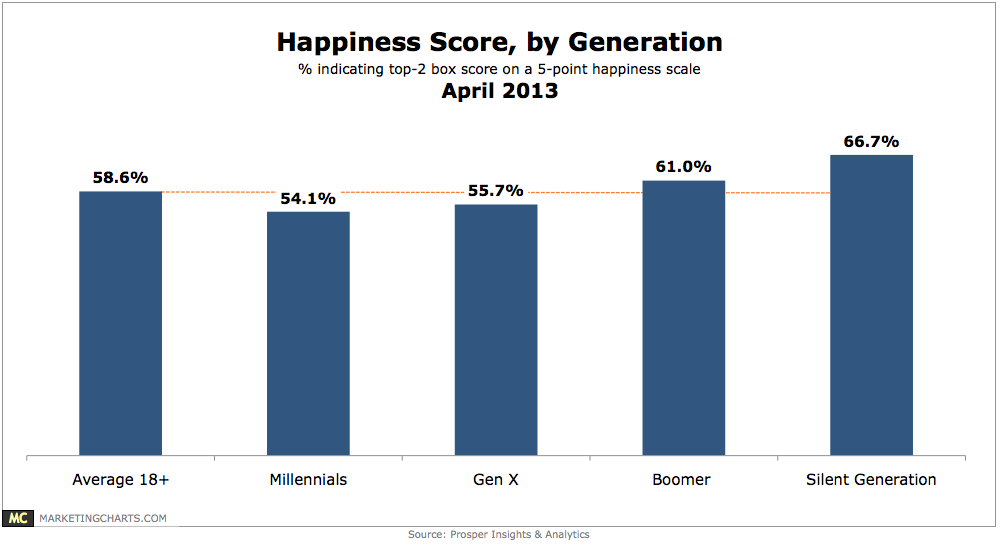
Millennials are 7.7% less likely than the average American to say they are happy.
Read MoreAverage Number Of Facebook Friends By Age, April 2013 [CHART]
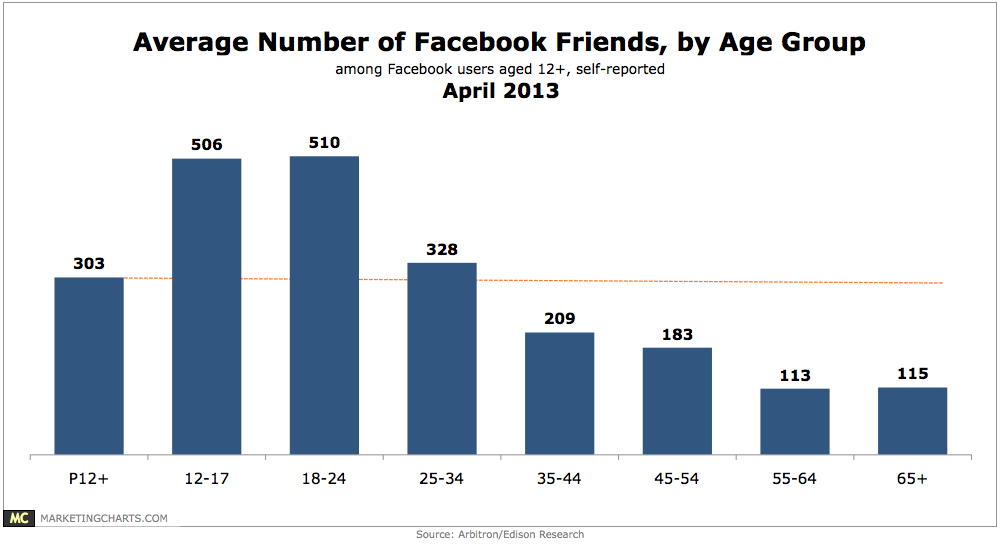
62% of Americans aged 12 and up report having a profile on a social network, and Facebook is easily dominant, used by 58% of Americans of that age.
Read MoreLikely Cable To Streaming Video Subscription Switchers [TABLE]
12% strongly agreed with the statement: I would consider replacing my cable subscription with a streaming media subscription (e.g., Netflix, Hulu Plus) in 2013.
Read MoreDemographics Of Mobile Social Media App Users By Time Spent, March 2013 [CHART]
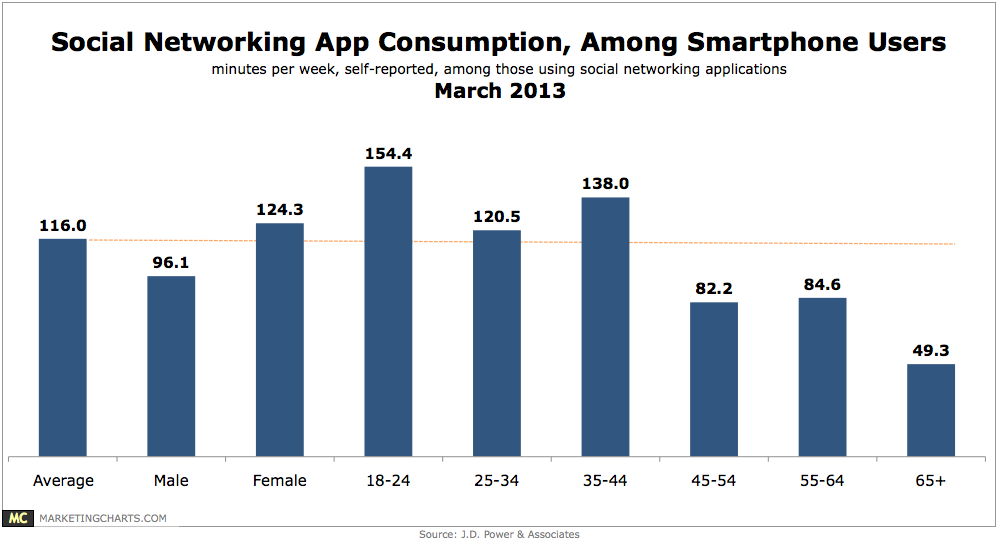
Female smart phone owners report spending a little more than 2 hours a week using downloaded social networking applications, compared to slightly more than 1-and-a-half hours for men, (124 minutes vs. 96 minutes).
Read MoreAmericans Most Valuable Household Services By Generation, March 2013 [TABLE]
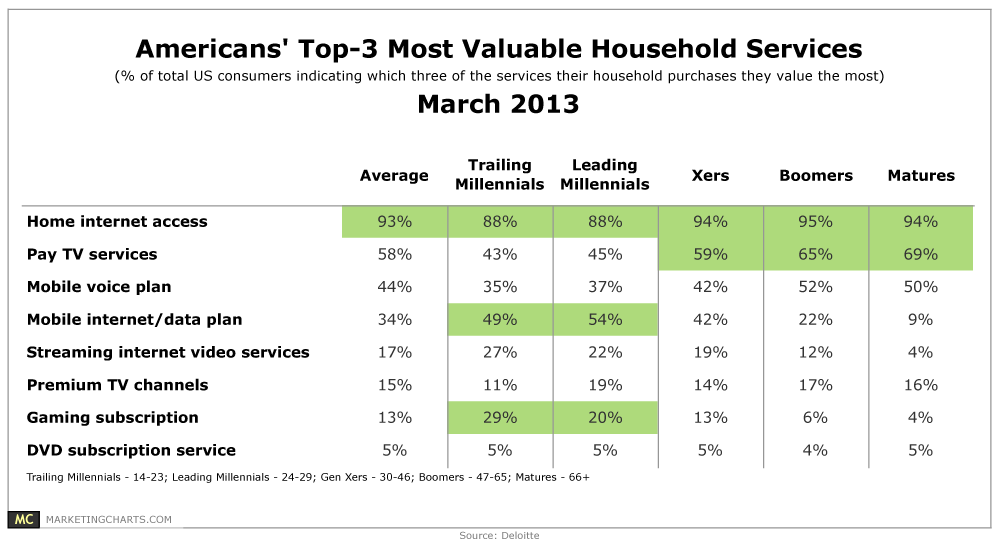
Young people are wedded to their mobile phones, and as a new survey from Deloitte shows, value their mobile data plans more than their pay TV services.
Read MoreUS Online Buyers By Generation, 2010-2016 [TABLE]
eMarketer’s estimate of online buyer penetration among internet users puts the figure at 63.7% for the 65-and-older population by the end of 2013.
Read MoreVideo Consumption By Platform & Generation, Q4 2012 [TABLE]
In Q4 2012, seniors averaged 220 hours and 55 minutes per month watching traditional TV.
Read More