Search Engine Optimization (SEO)
B2B eCommerce Website Features, November 2014 [CHART]
66% of B2B respondents noted customer expectations as a primary driver of their investment in omni-channel initiatives.
Read MoreLive Primetime Social TV Activities, February 2014 [TABLE]
78% of US internet users accessed second screens during shows, compared with 71% who did so during ads.
Read MoreMobile Voice Search Activities By Age Group, September 2014 [CHART]
55% and 41% of US teen and adult smartphone users conducted voice search daily, respectively.
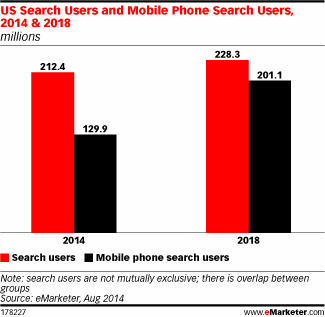
Read MoreUS Desktop vs Mobile Search Users, 2014 & 2018 [CHART]
eMarketer estimates that 40.7% of the US population will use a mobile phone to search the internet at least once per month in 2014.
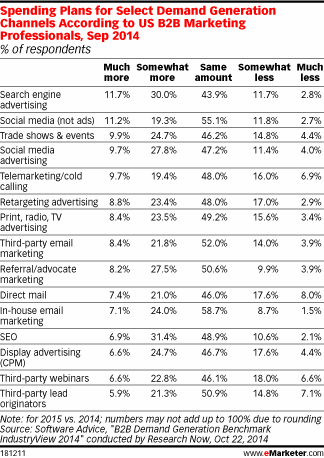
Read MoreB2B Spending Plans For Demand Generation Channels, September 2014 [TABLE]
41% of US B2B marketing professionals planned to increase spending on demand generation next year, compared with 17% who said they’d decrease investments.
Read MoreThe Life Of A B2B Sales Representative [INFOGRAPHIC]
This infographic from Qvidian illustrates the life and struggles a B2B sales representatives face on the job.
Read MoreMost Helpful Information In Search Results, October 2014 [CHART]
3 in 4 consumers who find local information in search results to be helpful report being more likely to visit stores.
Read MoreThe Internet Spec Sheet [INFOGRAPHIC]
Let this infographic by SumAll and Buffr (via AdWeek) server as your cheat sheet to the length of stuff online.
Read MoreGlobal Website Revenue Sources By Industry, July 2014 [CHART]
When it came to website revenues, organic search was the top source across all industries except media and entertainment.
Read More