Search Engine Marketing
Customer Insights Via Social Media, January 2013 [CHART]
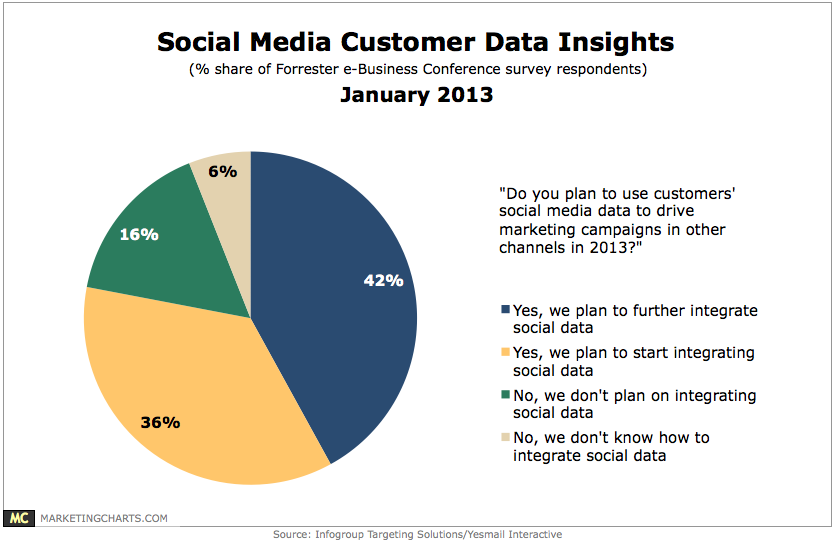
4 in 5 marketers said they plan to use customers’ social media data to drive marketing campaigns in other channels this year.
Read MoreHoliday eCommerce Traffic Sources, January 2013 [CHART]
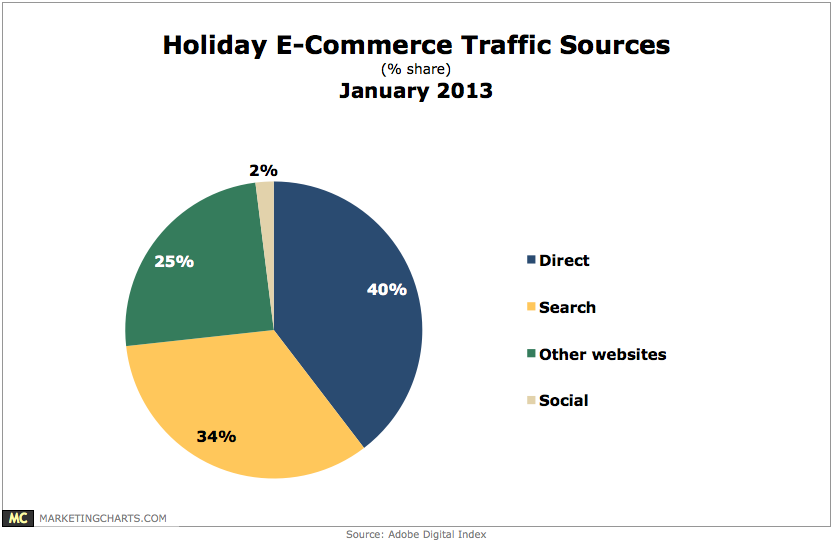
Only 2% of traffic to retailers during the holiday season came from social networks.
Read MoreMobile Search Engine Traffic Market Share, Q4 2012 [CHART]
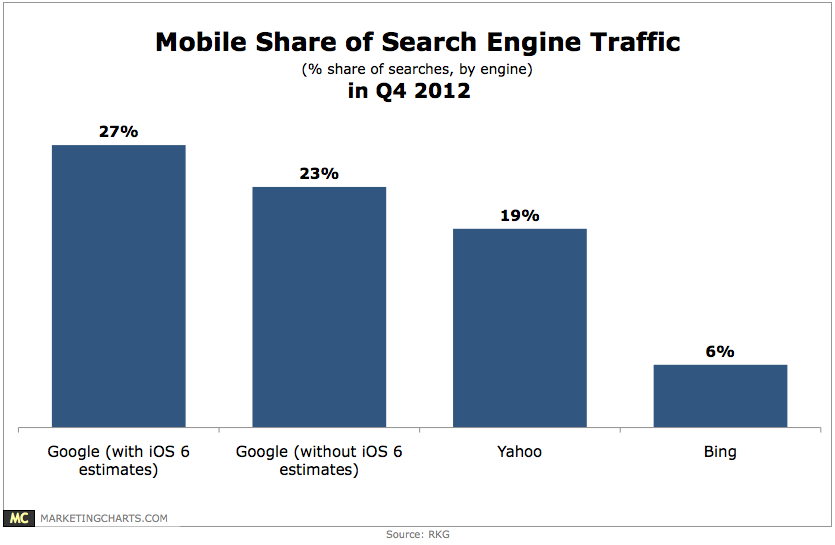
Mobile activity on Google far outpaced Yahoo and Bing.
Read MoreGoogle vs. Baidu: Global Search Engine Market Share, Q4 2012 [CHART]
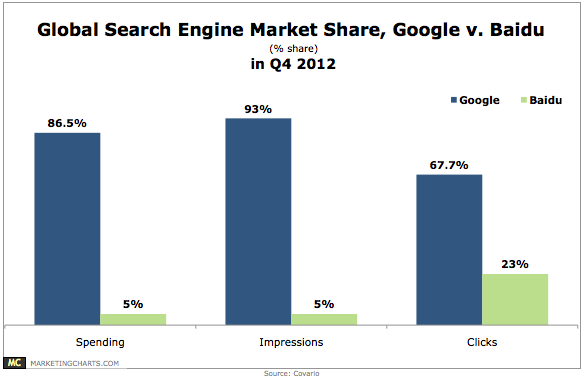
Google retained its dominant global search engine market share lead in Q4 2012 with 86.5% share of spending, 93% share of impressions, and 67.7% share of clicks, as advertisers increased their spending on the search engine by 13% year-over-year.
Read MoreGoogle Product Listing Ads vs. Text Search Ads, November-December 2012 [CHART]
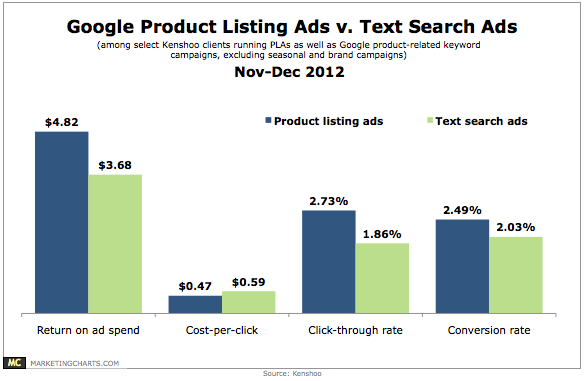
Google Product Listing Ads (PLAs) outshone text ads for retailers in Q3, and that trend followed on into the holiday season (November 1 – December 31).
Read MoreTop Android Mobile Apps Of 2012 [CHART]
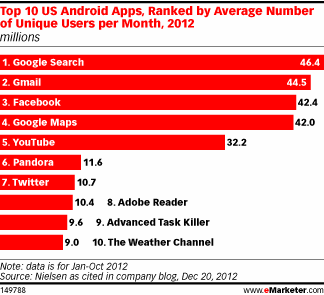
On Android, the Google Search app had the greatest number of average monthly unique users, followed by apps for Gmail, Facebook, Google Maps and YouTube.
Read MoreTop 10 Web Brands Of 2012 [CHART]
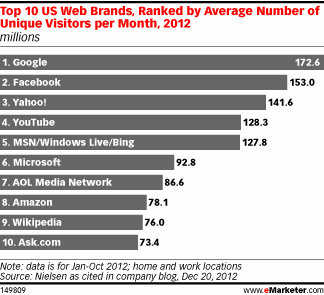
According to Nielsen, Americans on the web were most inclined to search, socialize, shop, browse or, of course, look things up on Wikipedia.
Read MoreUS Retail Search Advertising Metrics For 2012 Holiday Season [TABLE]
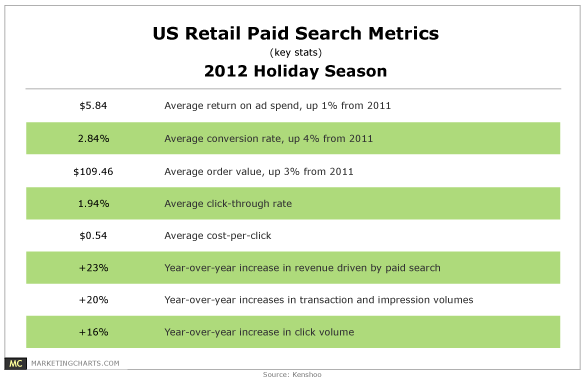
Average return on ad spend crept up 1% from last year to $5.84, while conversion rates increased 4% to 2.84%, and average order value was up 3% to $109.46.
Read MoreUS Mobile Paid Search Budgets By Tablets & Smart Phones, Q4 2012 [CHART]
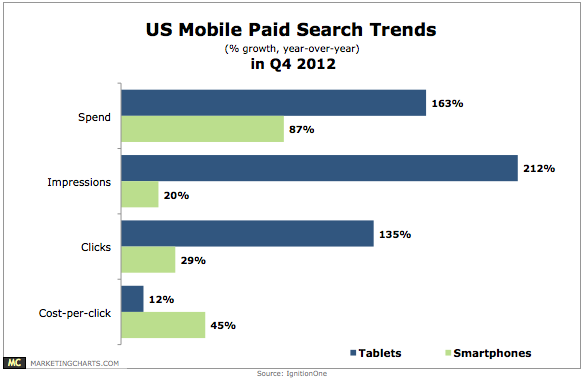
Mobile devices grew to account for 18% share of US paid search budgets in Q4 2012, from 16.3% in Q3.
Read MoreAmerican Search Advertising Click Behavior by Region & Age, January 2013 [CHART]
22% of online Americans say that they click on search engine ads.
Read More