Search Engine Marketing
Influencer Marketing Tools [INFOGRAPHIC]
This infographic by Izea illustrates influencer marketing tools and provides tips on how to use them.
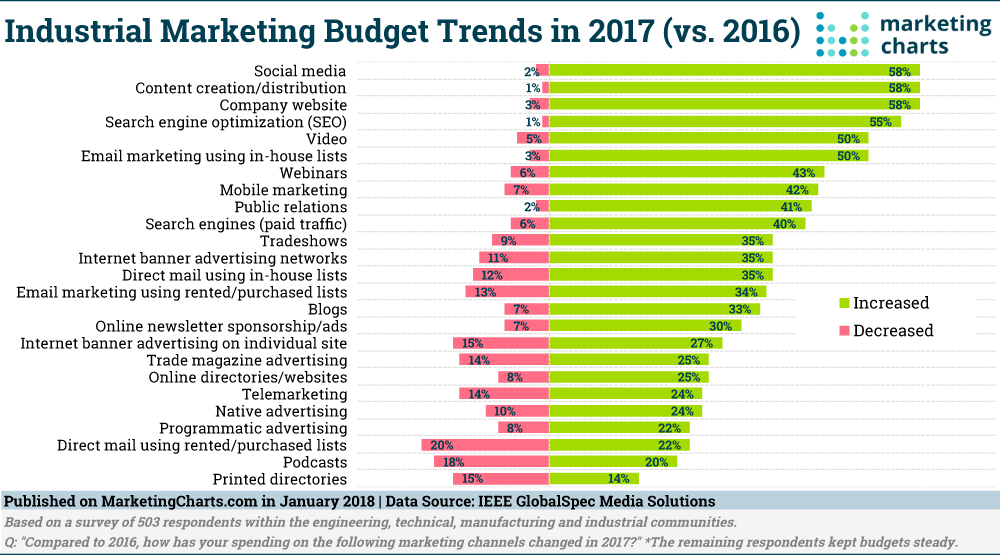
Read MoreMarketing Budget Trends For Industrial Companies In 2017 [CHART]
Almost 8 in 10 industrial marketers increased (31%) or maintained (48%) their budgets in 2017 relative to 2016. Websites, content and social media were the areas in which the most industrial marketers increased their spending in 2017, with 58% doing for each channel.
Read MoreLink Building Tactics [INFOGRAPHIC]
This infographic from Kissmetrics illustrates 14 link building tactics that do not include unsolicited emails.
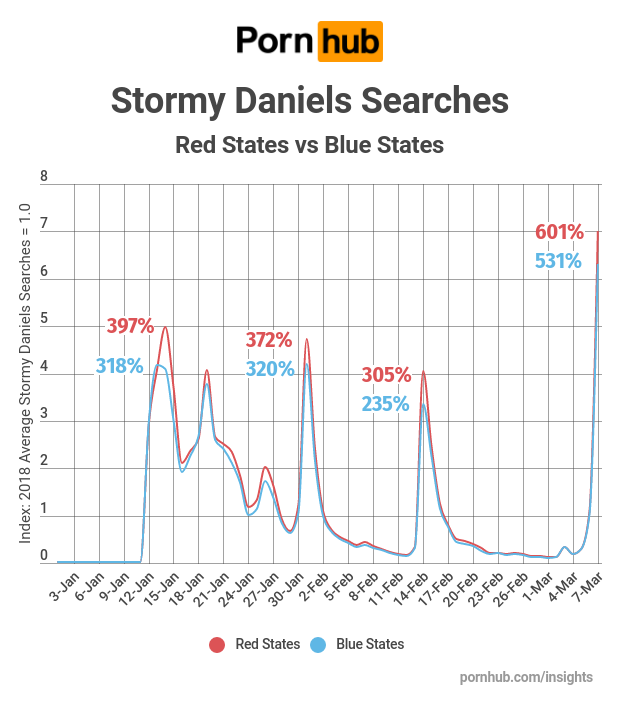
Read MoreStormy Daniels Searches Spike In The Wake Of News [CHART]
Pornhub Insights last wrote about pornstar Stormy Daniels’ searches back in January of 2018 shortly after her alleged affair with Donald Trump was revealed. At the time, searches for Stormy Daniels went from a daily average of 2500 to more than 2 million searches in just 5 days!
Read MoreSEO For Small Business [INFOGRAPHIC]
This infographic from milkwhale illustrates 55 must-know SEO tricks for small business websites.
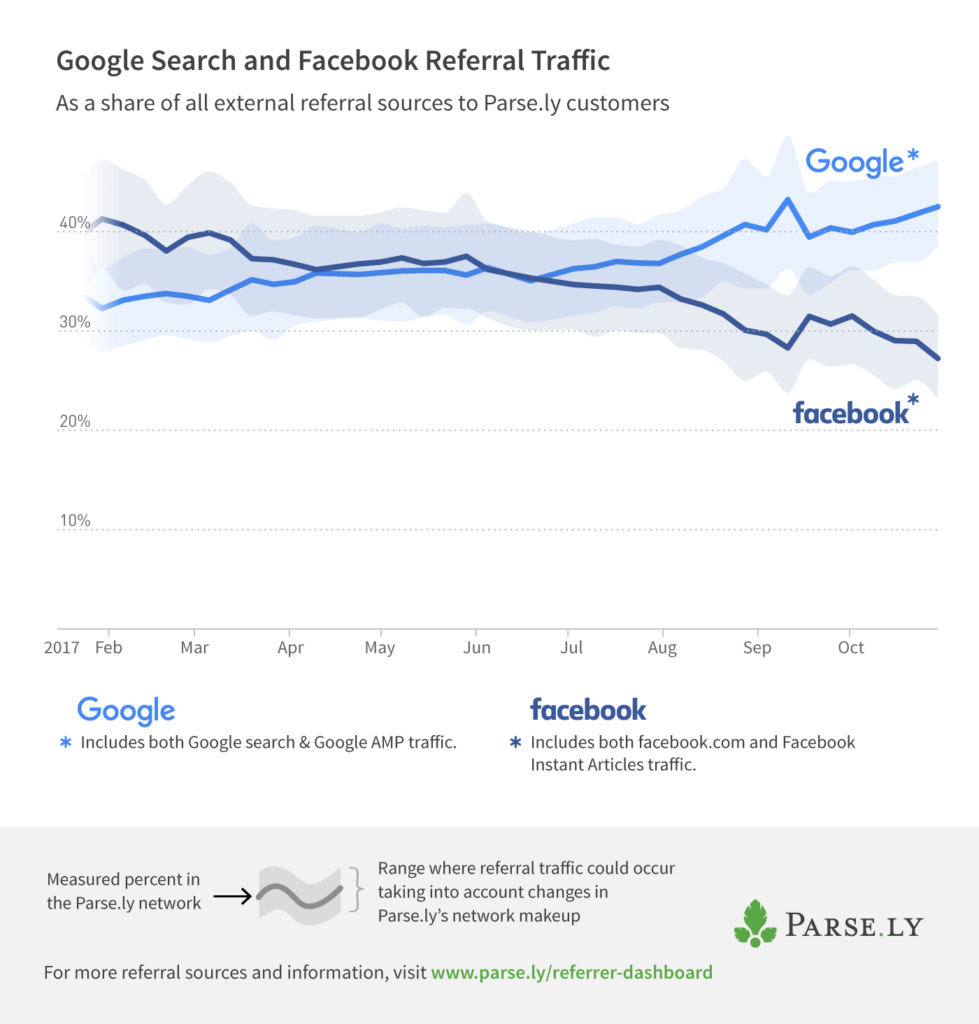
Read MoreGoogle vs Facebook Referral Traffic, 2017 [CHART]
This Parse.ly data reflects the upward trend in referral traffic from Google (all – including AMP – Google’s Accelerated Mobile Pages format) and declining trend in referral traffic from Facebook specifically (all Facebook – including Instant Articles).
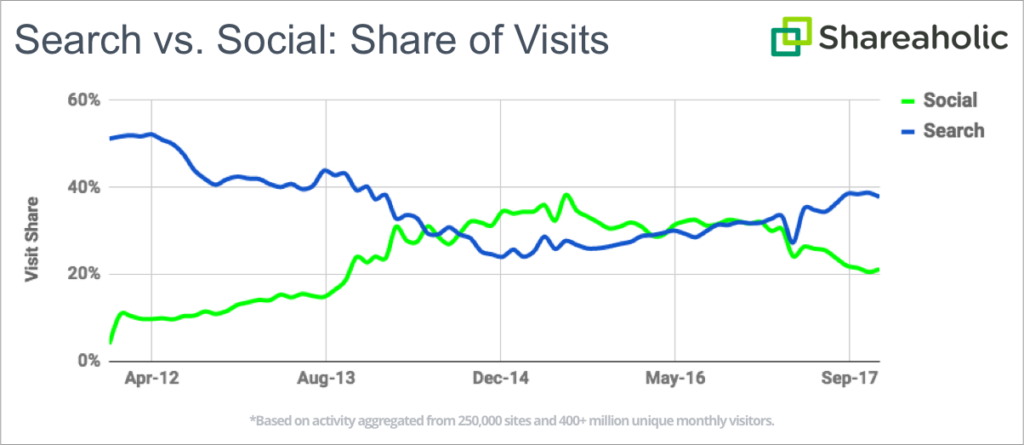
Read MoreSearch Engine vs Social Traffic, 2011-2017 [CHART]
Google was the top overall traffic referrer for the year, and owned a 36.82 percent share of visits during the second half of 2017.
Read MoreThe Value Of Long-Form Content [INFOGRAPHIC]
This infographic illustrates some of the benefits of long-form content, why it’s worth creating and how to do it well.
Read MoreThe Visual Internet [INFOGRAPHIC]
This infographic by Frames Direct illustrates the evolution of the Internet from a text-only to a visual medium.
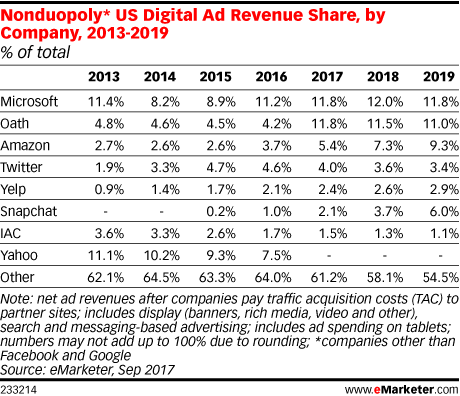
Read MoreUS Digital Ad Revenue Share By Companies Not Named Google Or Facebook [TABLE]
Google and Facebook accounted for about 63% of US digital ad revenues in
2017. With the duopoly taking in almost two-thirds of US digital ad revenues, that leaves around a third of the market for every other firm to compete for.

