Search Engine Marketing
Top 5 Reasons For Using Responsive Web Design [INFOGRAPHIC]
This infographic from Genetech illustrates five reasons you should adopt responsive web design.
Read MoreShare Of eCommerce Visits By Traffic Source, Q4 2012-Q4 2013 [CHART]
Search accounted for 32.6% of website visits, up from 29.8% a year earlier, and leaps and bounds ahead of both email (2.7%) and social (1.1%).
Read MoreDaily Mobile Activities, February 2014 [CHART]
Smart phone owners spend a whopping 3.3 hours per day on their phones, while tablet owners are close behind, averaging 3.1 hours a day on their devices.
Read MoreOnline Activities Performed By TV Viewers, November 2013 [TABLE]
Searching the internet for information was the most common activity conducted while watching TV.
Read MoreImportance Of National vs Local Online Tactics, December 2013 [CHART]
While nearly three-quarters of digital brand marketers in the region invested in local marketing, just 8% were Completely Satisfied with such efforts.
Read MoreRogers High School Social Media Controversy [VIDEO]

Rogers High School student Reid Sagehorn’s ill-considered tweet will likely force him to explain his role in this controversy for the rest of his life.
Read MoreUS Online Ad Spending Growth By Format, 2012-2017 [TABLE]
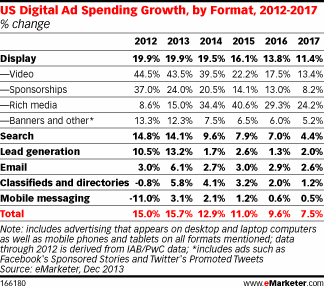
Programmatic buying, native advertising and viewability all remain topical to digital display advertisers, particularly brands.
Read MoreTop Retail Site Load Speeds, February 2014 [CHART]
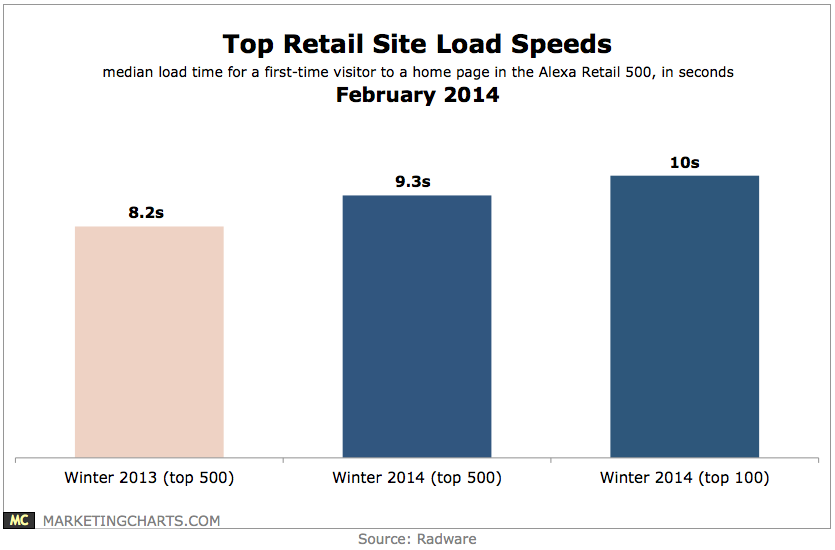
The median load time for home pages of the top 500 US retail websites (as ranked by Alexa) continues to slow down, clocking in at 9.3 seconds during the Winter period, 21% slower than the 7.7 seconds from a year earlier.
Read MoreGoogle Suggest Results For Major Brands [INFOGRAPHIC]
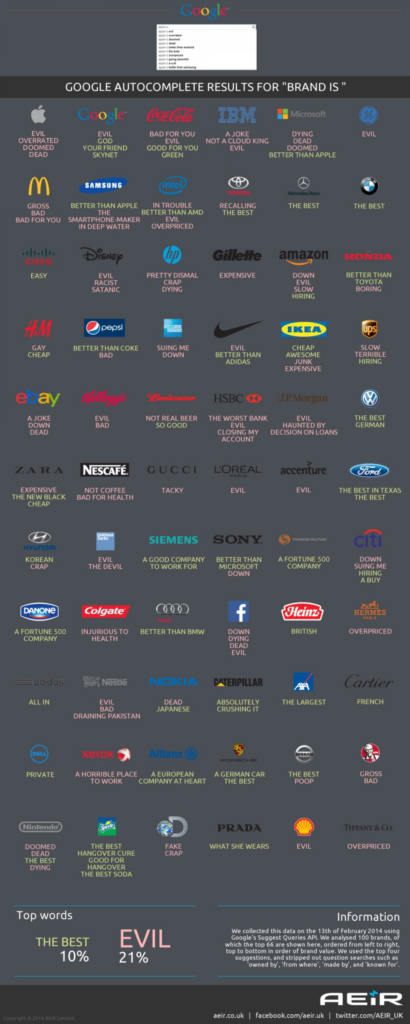
This inforgaphic by AEIR Limited illustrates Google Suggest results for Brand Is… searches for major brands.
Read MoreSocial Media Users In 2013 By Network [INFOGRAPHIC]
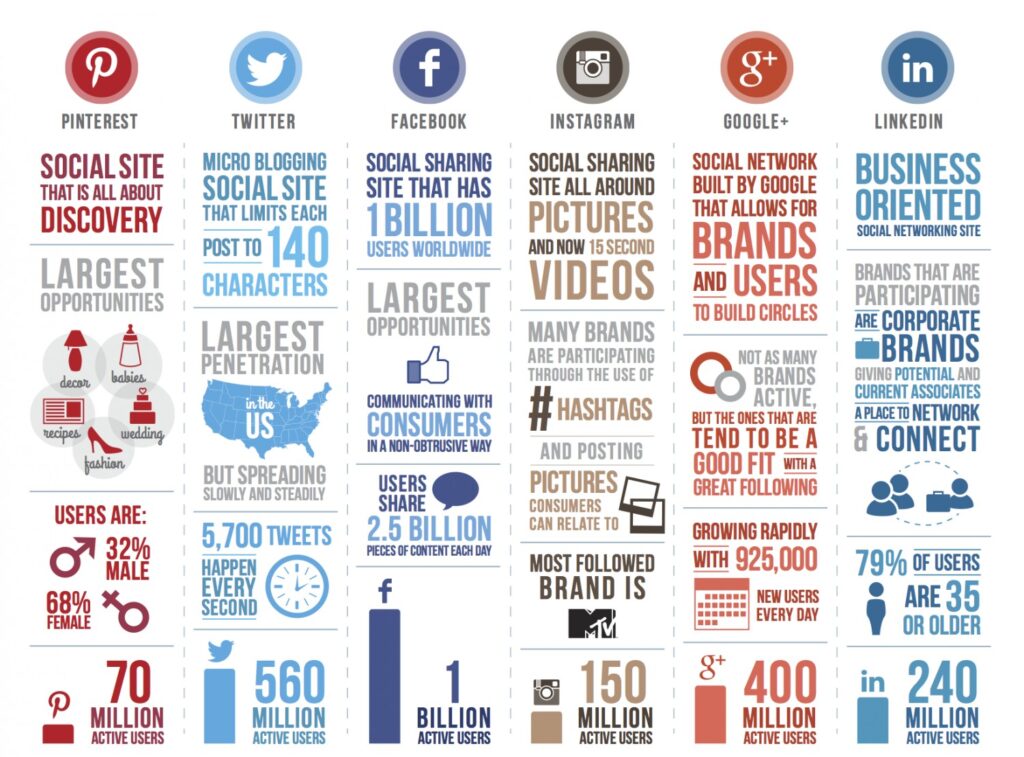
This infographic by Mark Taylor illustrates 2013 statistics for Pinterest, Twitter, Facebook, Instagram, Google+ and LinkedIn.
Read More