Search Engine Advertising
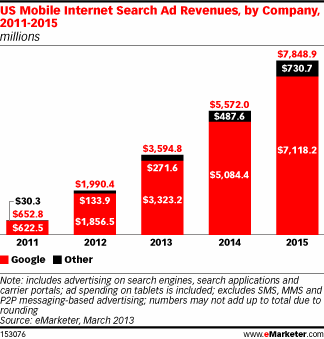
US Mobile Search Ad Revenues, 2011-2015 [CHART]
Google is by far the largest player with 93.3% of US net mobile search ad dollars going to the company last year.
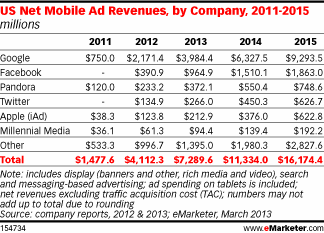
Read MoreUS Net Mobile Ad Revenues By Channel, 2011-2015
eMarketer revised its estimate for 2012 spending only slightly upward from the previous forecast in December 2012.
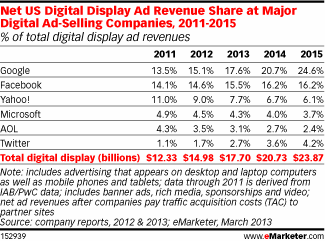
Read MoreUS Online Advertising Revenue Share At Major Ad Networks, 2011-2015 [TABLE]
Yahoo!’s share of net US display ad revenues is expected to decline again this year to 7.7%, down from 9% in 2012 and 11% in 2011.
Read MoreUS Online Display Advertising Revenue Growth At Major Ad Networks, 2011-2015 [TABLE]
The 18.1% growth expected this year for US display advertising is down somewhat from more robust rates of increase in 2011 and 2011.
Read MoreUS Search Ad Revenue Market Share, 2011-2015 [TABLE]
Google’s share of net US search ad revenues is expected to reach 73.7% this year, up from 72.8% in 2012.
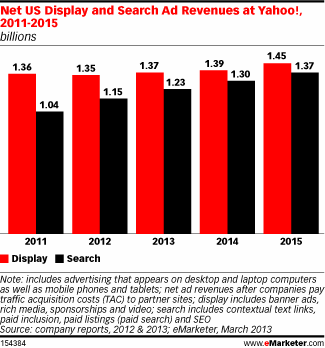
Read MoreYahoo!'s Display & Search Advertising Revenues, 2011-2015 [CHART]
eMarketer estimates net US search ad revenues at Yahoo! will grow 7% to $1.23 billion this year, up from $1.15 billion in 2012.
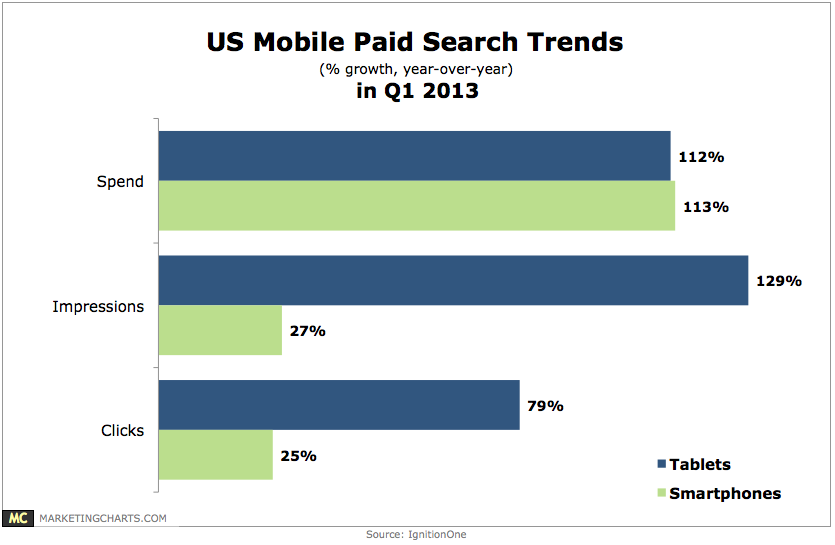
Read MoreUS Mobile Search Advertising Metrics By Device, Q1 2013 [CHART]
Search advertising spending on tablets increased by 113% year-over-year in Q1 2013, representing 64% of mobile search spend.
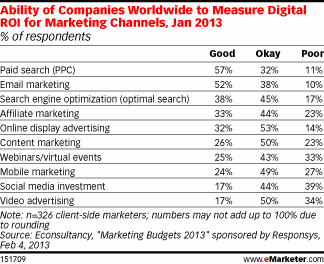
Read MoreMeasuring ROI For Online Marketing Channels, January 2013 [TABLE]
In January 2013, the greatest percentage of companies reported a good ability to measure the ROI of paid search.
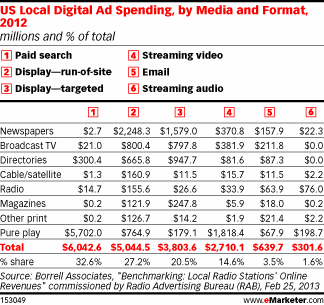
Read MoreUS Local Online Ad Spending By Media & Format, 2012 [TABLE]
The pace of increase helped expand digital radio advertising’s share of total local digital ad dollars by one-fifth of a percentage point, to 2% of the total.
Read MoreOnline Marketing Success Factors [CHART]
Design, development and maintenance of the corporate website was cited by 45% of respondents as contributing to marketing success.
Read More