Print Advertising
US Hispanic Ad Spending By Media, 2011 & 2012 [TABLE]
Hispanic ad spending was up 11.1% last year, as US marketers spent nearly $8 billion on major media targeted toward Hispanic consumers.
Read MoreMagazine Advertising Trends, H1 2013 [CHART]
Consumer magazine print ad pages declined by 4.9% year-over-year in the first half (H1) of 2013.
Read MoreGlobal Ad Spending Forecast By Medium, 2012 vs 2013 [TABLE]
Warc believes that global expenditures will now increase by 3.4% as opposed to an initial assessment of 4% growth made in January.
Read MoreTop Lead Prospecting Channels, 2012 vs 2013 [CHART]
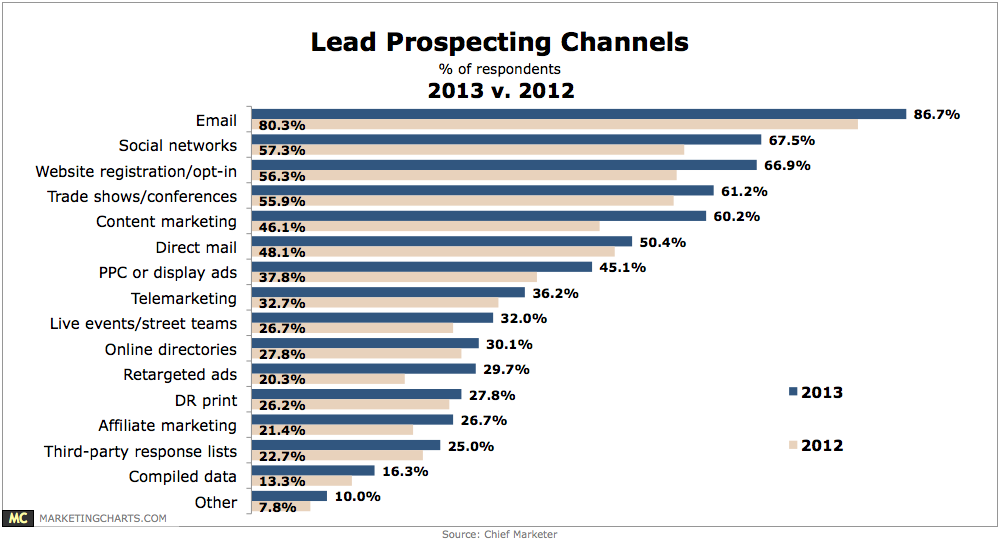
Marketers are ramping up their use of prospecting tools and while email remains the most common prospecting channel (86.7% using this year).
Read MoreBest Sources For Marketing & Advertising, June 2013 [CHART]
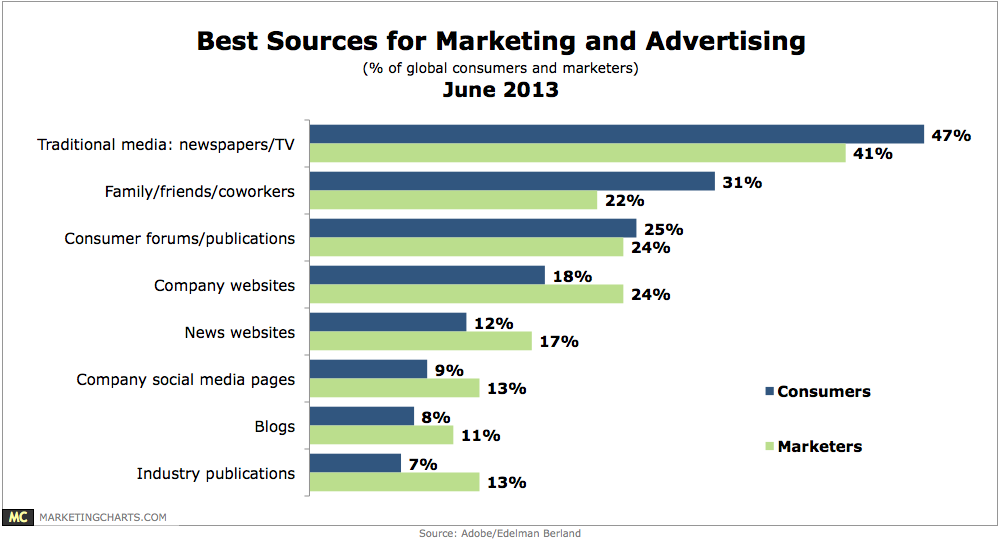
Consumers were more likely than marketers to choose traditional media sources such as newspapers and TV as best for advertising (47% vs. 41%), and also more likely to see their family, friends and co-workers as influential (31% vs. 22%).
Read MoreAd Spending Share Of US Automobile Dealerships By Media, 2002-2012 [TABLE]
Dealers have dramatically increased their digital ad spending over the past decade, from just 5.0% of spending in 2002 to 26.5% in 2012.
Read MoreUS Traditional Media Revenue Outlook, 2013-2017 [CHART]
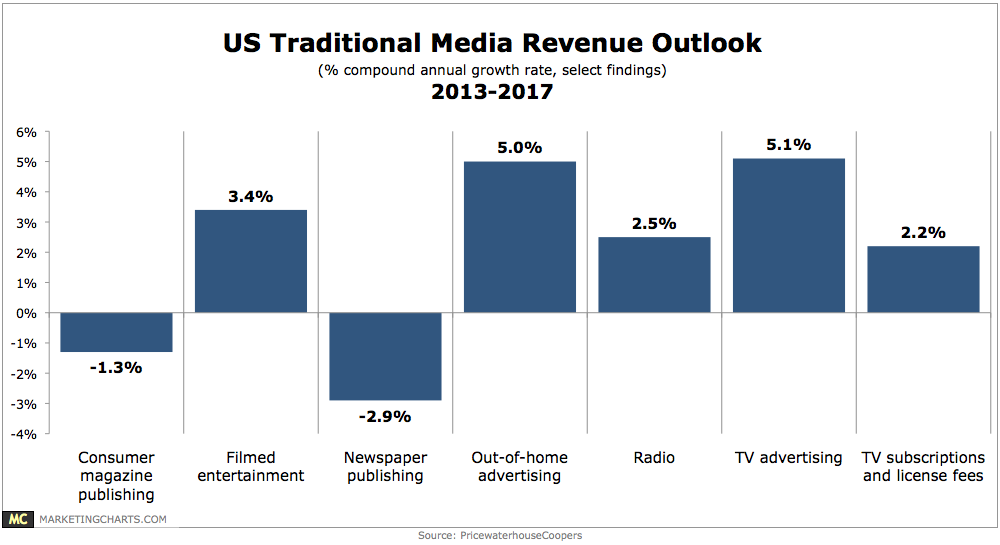
PwC has issued its annual “Entertainment & Media Outlook” report, which contains projections for online and offline media markets through 2017.
Read MoreUS Print vs. iPad Magazine Ad Units, Q1 2012 & Q1 2013 [TABLE]
The number of ad units available on just the iPad increased nearly 24%, giving the iPad editions 56% of the total number of ad units as on print pages.
Read MoreMarketing Attribution Channels, October 2012 [CHART]
Email and paid search are some of the easiest channels to include in attribution programs.
Read MoreAdvertising Effectiveness For Prompting Social Interactions With Brands, May 2013 [CHART]
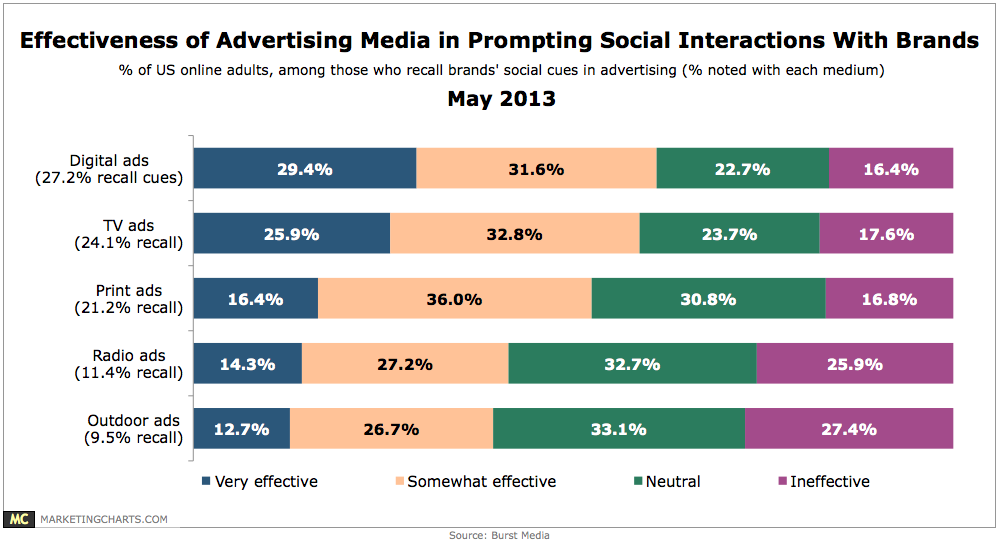
Respondents reported being most likely to notice brand-related social accounts in online banner ads (27.2%), but a relatively high number also notice them in TV (24.1%) and print (21.1%) ads.
Read More