Photo Marketing
Frequency With Which People Share Information About New Products On Social Media [TABLE]
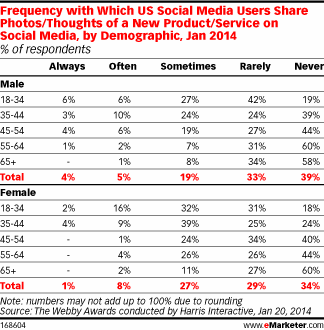
The majority of posts on social networks about new products and services came from women, especially those 44 and younger.
Read MoreThe Personality Types Of Popular Facebook Pages [INFOGRAPHIC]
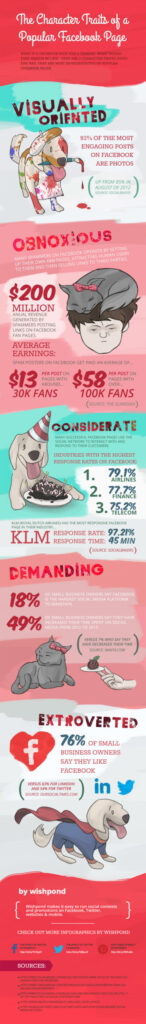
This infographic by Wishpond illustrates popular Facebook pages by personality type.
Read MoreSocial Revenue Per-Visit, Q4 2012 vs Q4 2013 [CHART]
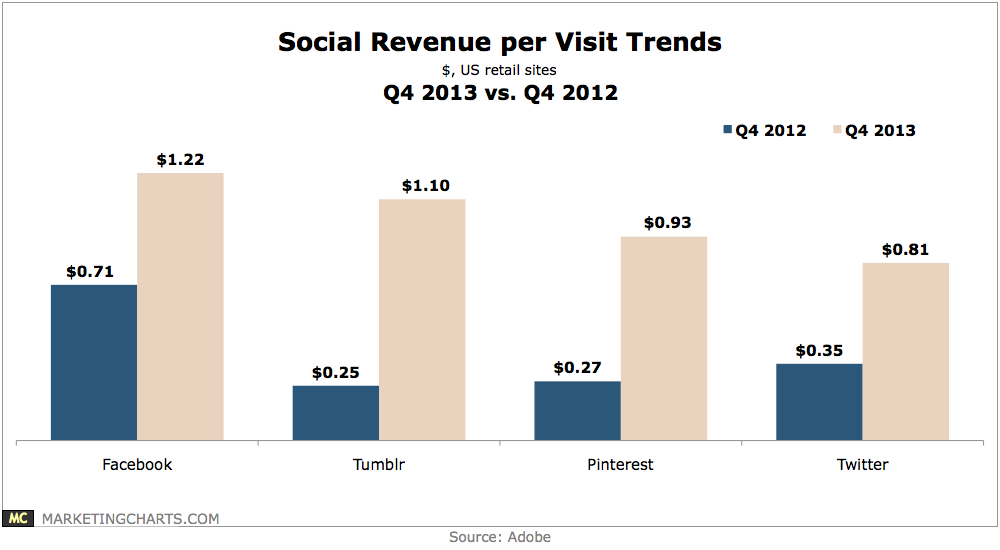
None of the major platforms’ revenue-per-visit (RPV) grew quite as quickly on a year-over-year basis as Tumblr: the network’s RPV shot up by 340% to $1.10 in Q4 2013.
Read MoreInternal Marketing Teams' Weaknesses At Online Marketing [CHART]
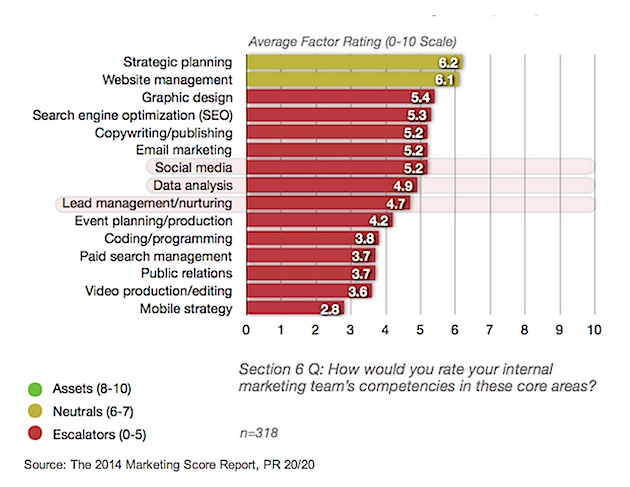
The professionals surveyed especially lack confidence in their internal marketing teams
Read MoreTop Weaknesses Of Internal Marketing Teams [CHART]
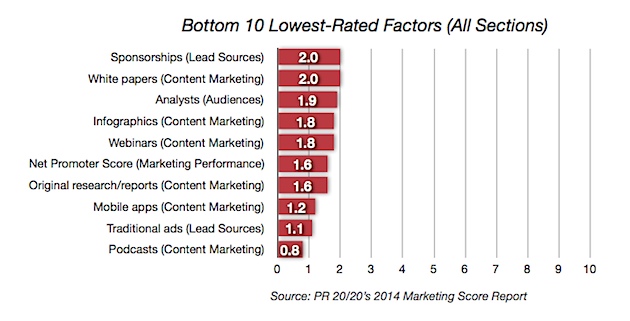
Business professionals say they are weakest at finding sponsorships/lead sources (2.0 average sore), creating whitepapers (2.0), and doing analysis (1.9).
Read MoreSocial Media In 2013 [INFOGRAPHIC]
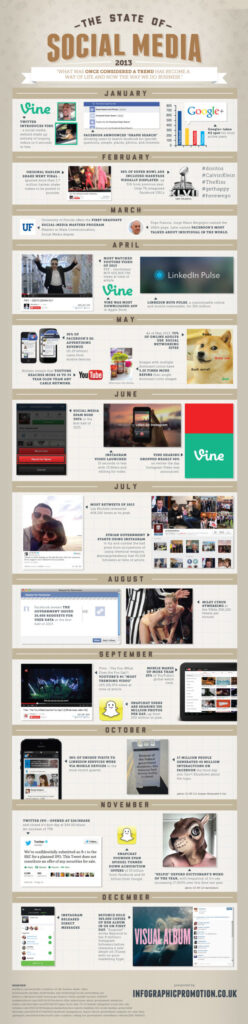
This infographic illustrates significant events in social media during 2013.
Read MoreDesktop-Only Social Network Visitors, 2013 [CHART]
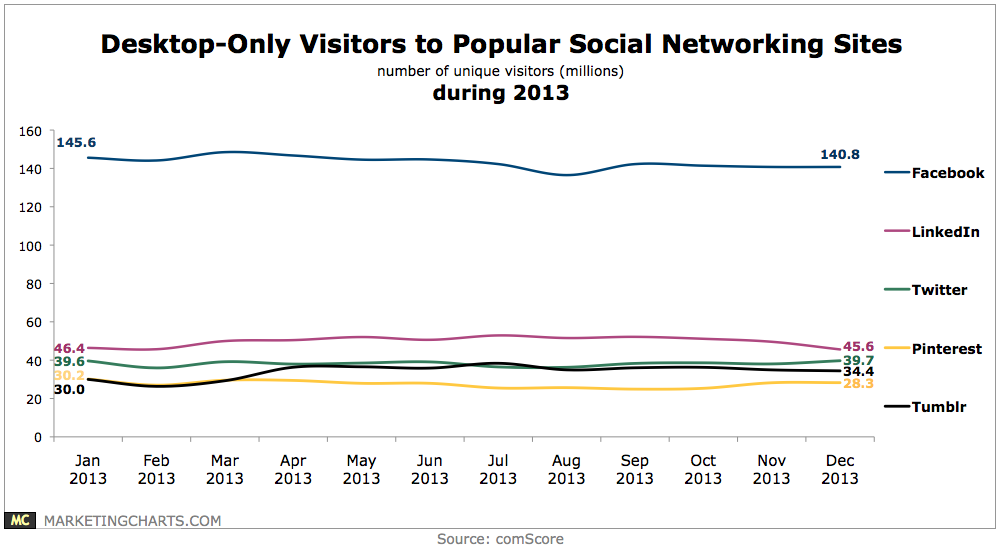
Facebook remains the leader in desktop-only visitors by a large margin, although its numbers appeared to dip slightly during the year.
Read MoreRetail Brand Social Adoption By Channel, January 2014 [CHART]
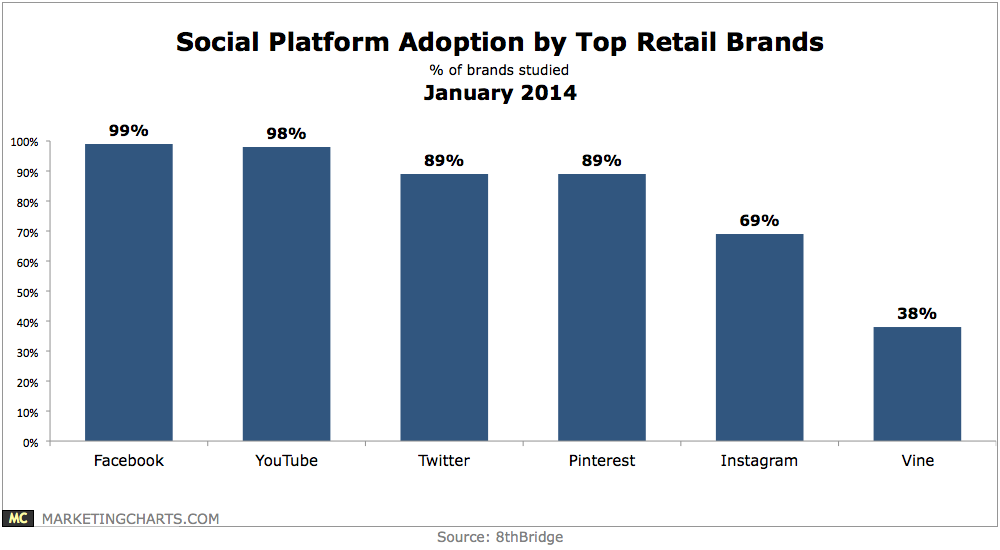
Some 38% of retail brands have already begun using Vine.
Read MoreContent Sharing Growth By Channel, 2013 [CHART]
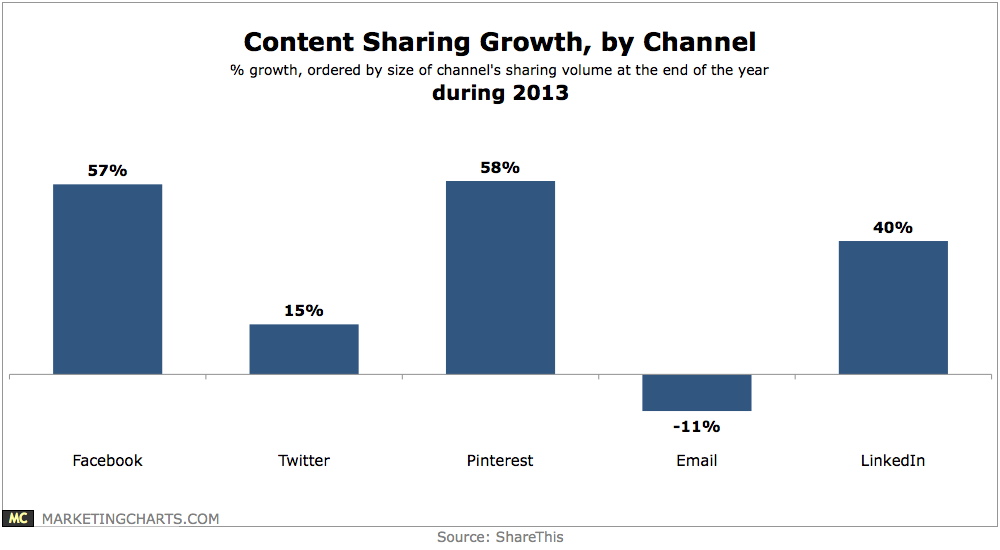
Content sharing to Pinterest increased by 58% during 2013, propelling the social network past email in Q4 to become the third-most preferred social sharing channel.
Read MoreWhere Home Improvers Get Inspiration, 2012 & 2013 [TABLE]
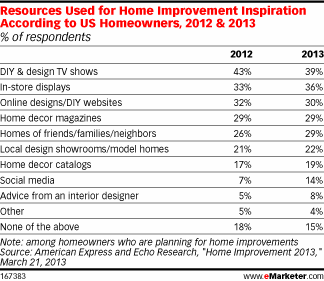
Data released in March 2013 by American Express and Echo Research revealed a large increase—albeit over a very small base—in homeowners who said social media provided inspiration for home improvement.
Read More