Outdoor Advertising
US Out-Of-Home Ad Revenues Grow, Q2 2011 – Q4 2013 [CHART]
Q4 2013 marks the 15th consecutive quarter of year-over-year revenue growth, with restaurants (+11%) the fastest-growing category.
Read MoreUS Media Ad Spending Share By Media, 2012-2018 [CHART]
TV will remain the dominant advertising channel, making up 38.1% of total media spending in 2014.
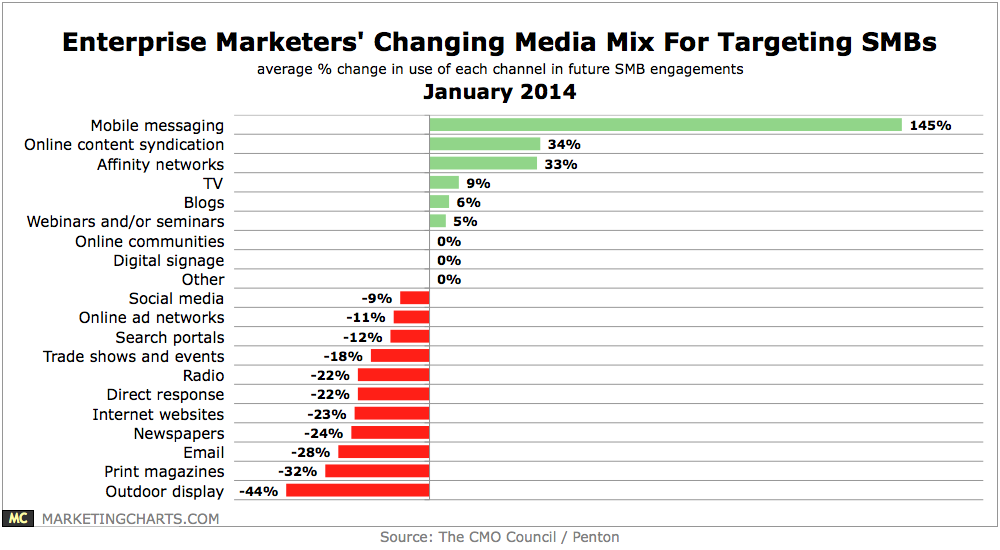
Read MoreEnterprise Marketers' Changing Media Mix For Targeting SMBs, January 2014 [CHART]
Enterprise-level marketers who sell to the SMB market are planning to make interesting changes to their media mix.
Read MoreGlobal Ad Spending Growth By Medium, Q1-Q3 2013 [CHART]
Global ad spending across major media grew by 3.2% year-over-year during the third quarter of 2013.
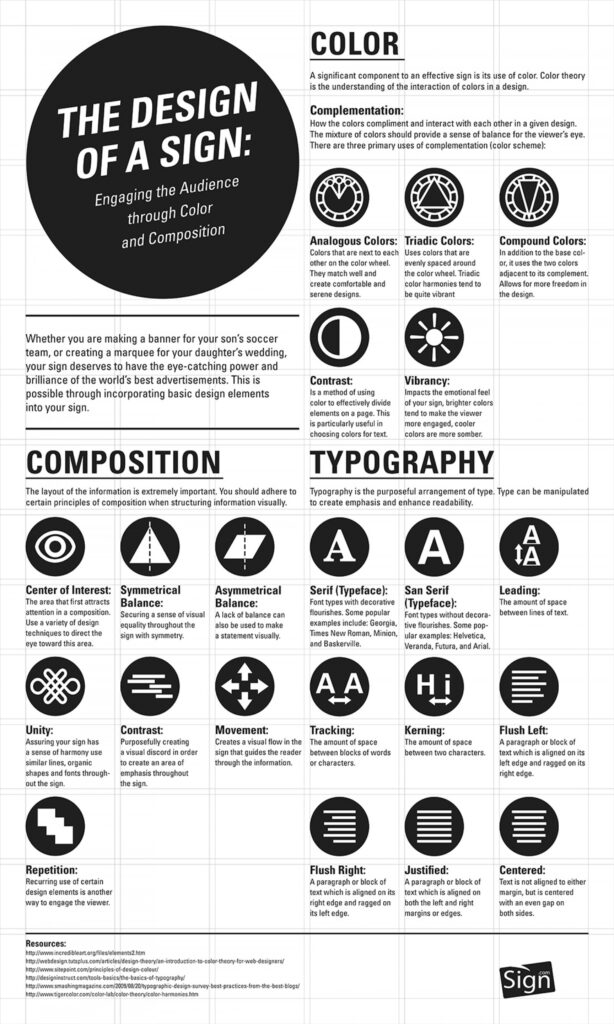
Read MoreThe Elements Of Sign Design [INFOGRAPHIC]
This infographic from Sign.com illustrates the elements that contribute to an engaging and effective sign.
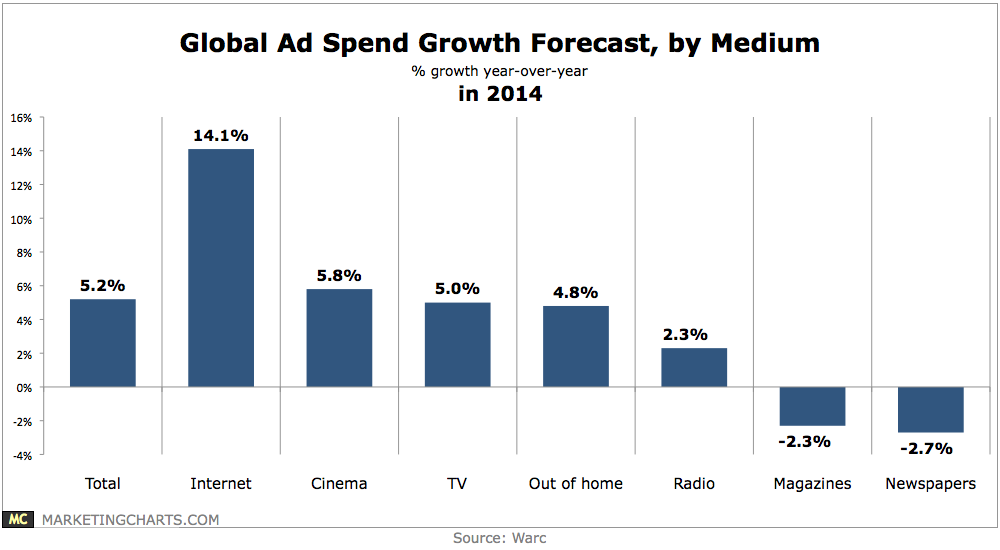
Read MoreGlobal Ad Spending Growth By Medium In 2014 [CHART]
Global ad spending will increase by 5.2% this year, a significant uptick from the predicted growth of 3.2% for 2013, but a slight cut from a prior forecast of 5.4% growth.
Read MoreOnline Behavior Of The Home Improvement Customer [INFOGRAPHIC]
This infographic illustrates the online behavior of home improvement customers by generation.
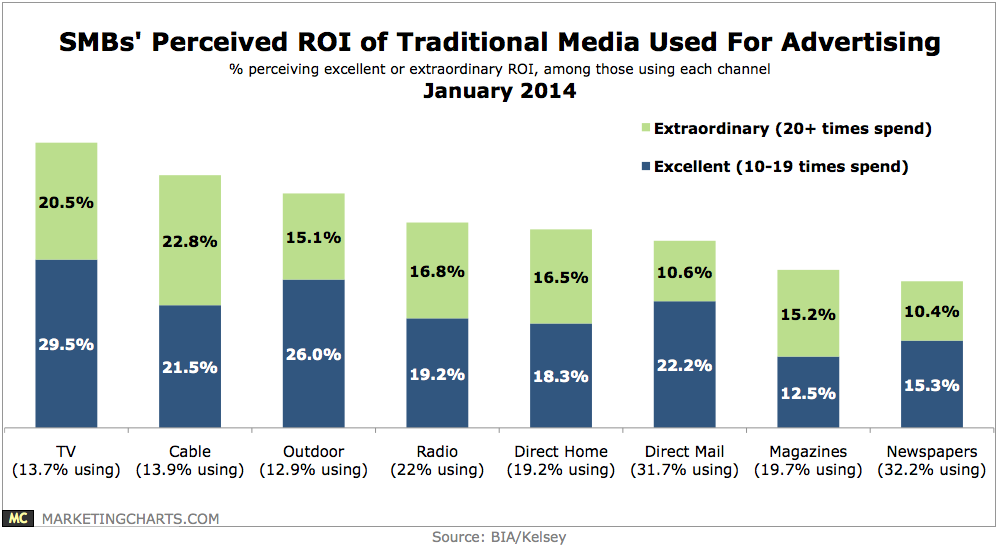
Read MoreSMBs' Perceived ROI Of Traditional Media Advertising, January 2014 [CHART]
Newspapers (32.2%) and direct mail (31.7%) are the traditional media most commonly used by SMBs for advertising and promotion,
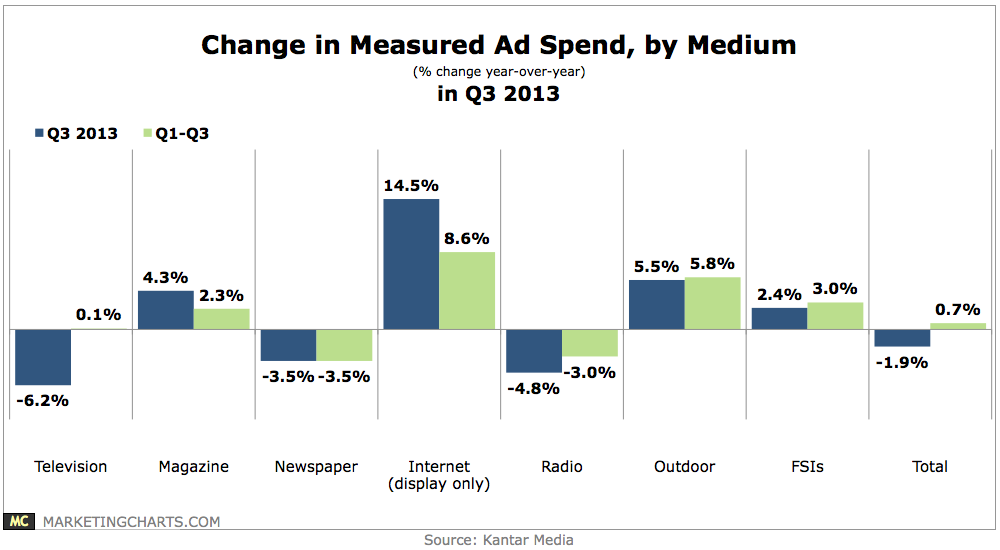
Read MoreChange In Ad Spend By Medium, Q3 2013 [CHART]
Total ad expenditures in Q3 were down 1.9% year-over-year, an unsurprising result given last year’s outlays on the Summer Olympics and political campaigns.
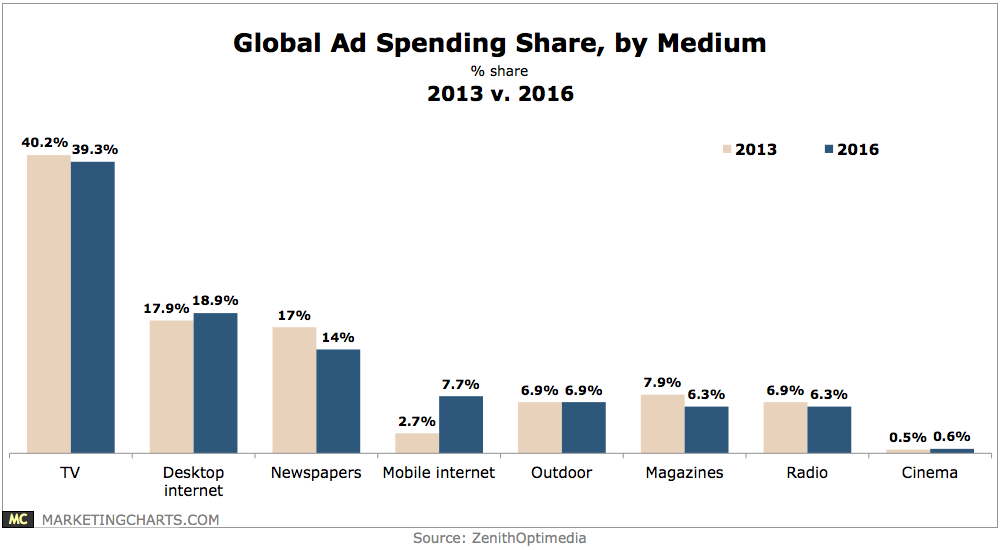
Read MoreGlobal Ad Spending Share By Medium, 2013 vs 2016 [CHART]
ZenithOptimedia predicts mobile advertising will generate more new ad spending ($31.8 billion) than TV ($29.8 billion) from this year through 2016.
Read More