Outdoor Advertising
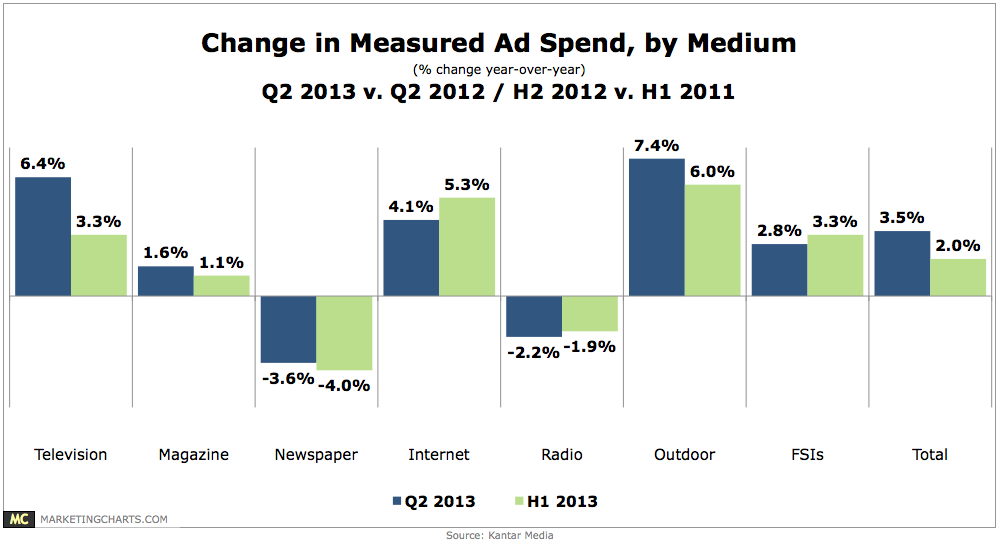
Changes In Ad Spending By Medium [CHART]
US ad spending increased by 3.5% year-over-year in the second quarter of the year to reach $35.8 billion, dragging first-half expenditures up by 2% to $68.9 billion.
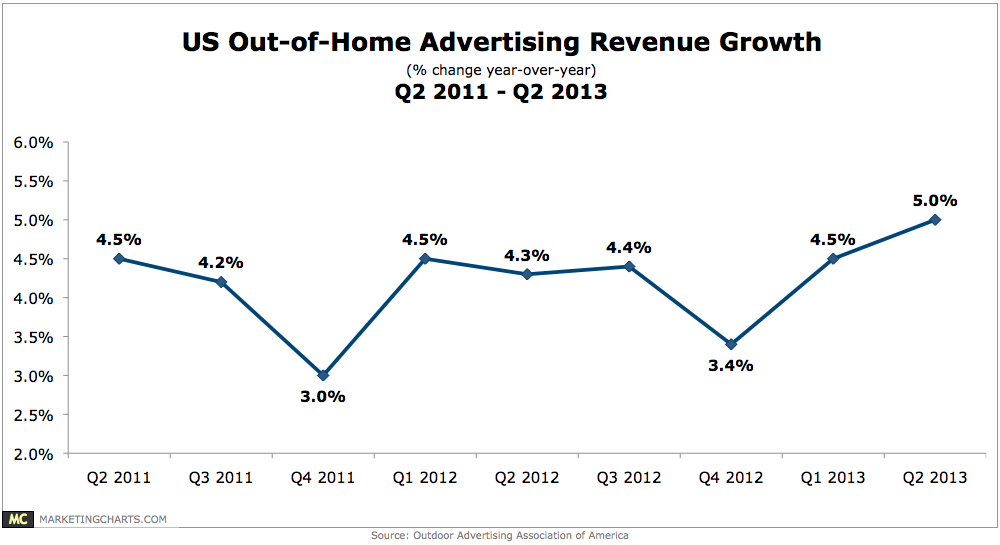
Read MoreOutdoor Advertising Revenue Growth, Q2 2011 – Q2 2013 [CHART]
After outdoor advertising revenues increased by 4.5% in Q1, revenues climbed 5% in Q2 to reach $2.15 billion.
Read MoreUS Total Ad Spending By Media, 2011-2017 [TABLE]
eMarketer expects TV to continue to capture the largest share of paid ad spending in the US for the foreseeable future, though its percentage of total spending will drop slightly, from 39.1% in 2012 to 38.8% this year.
Read MoreChanges In B2B Marketing Spending During Next Year, March 2013 [TABLE]
45% B2B marketers expected to increase search engine advertising spending.
Read MoreB2B Marketers' Most Successful Platforms, August 2013 [CHART]
Face-to-face event attendance is rated the most successful platform, by a fairly wide margin.
Read MoreGlobal Ad Spending Growth By Medium, Q1 2013 [CHART]
Ad spending on TV around the world grew by 3.5% in Q1, outpacing the aggregate increase of 1.9%.
Read MoreGlobal Ad Spending Forecast By Medium, 2012 vs 2013 [TABLE]
Warc believes that global expenditures will now increase by 3.4% as opposed to an initial assessment of 4% growth made in January.
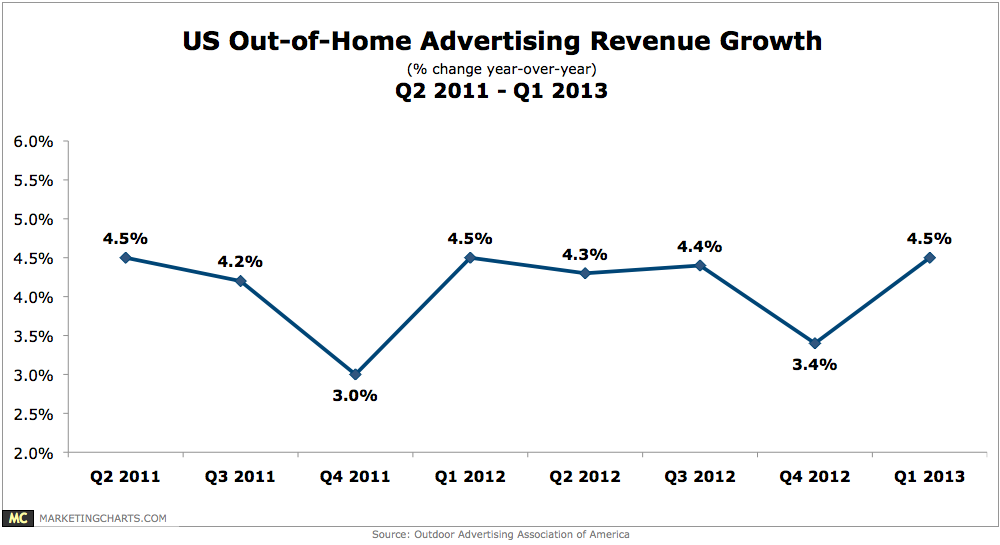
Read MoreUS Outdoor Ad Revenue Growth, Q2 2011 – Q1 2013 [CHART]
Outdoor ad spending was up 4.5% year-over-year in Q1, reaching $1.5 billion.
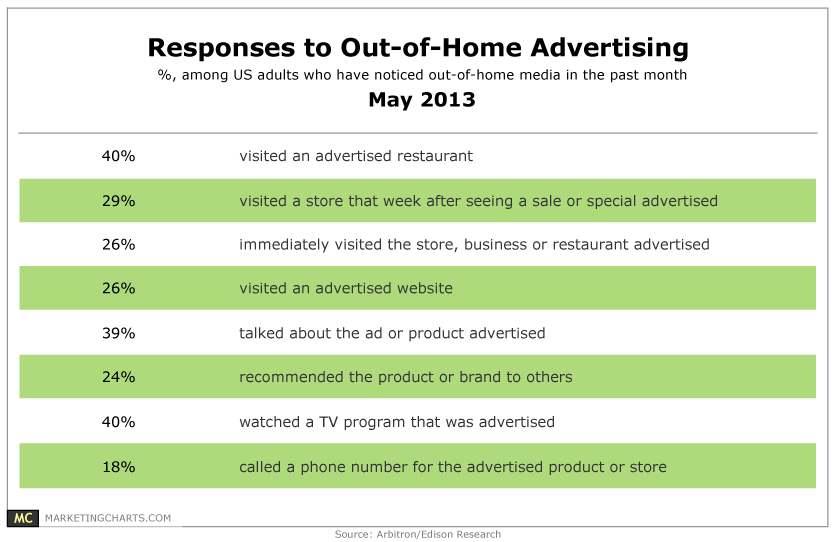
Read MoreResponses To Out-Of-Home Advertising, May 2013 [TABLE]
3 in 4 American adults report having noticed billboard (static or digital), transit or street-level advertising in the past month.
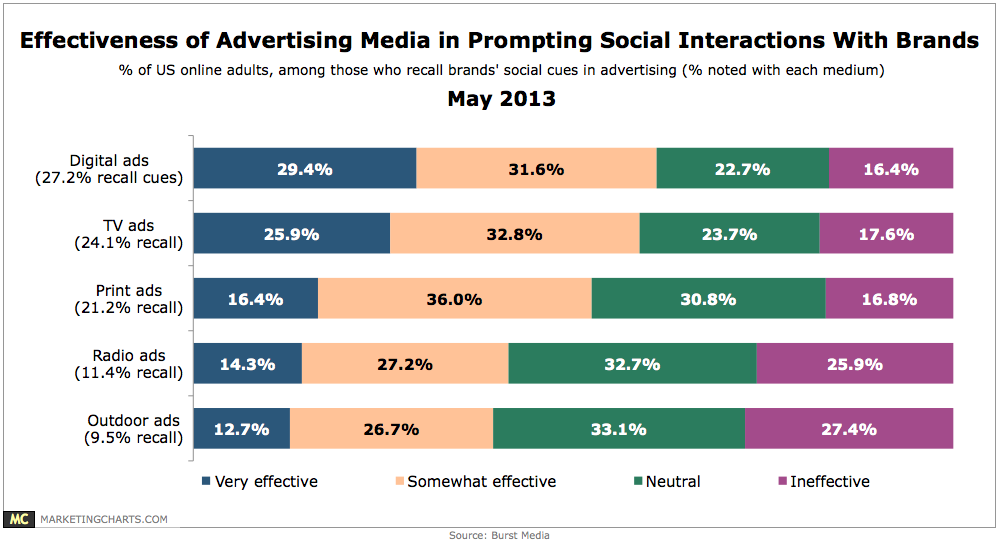
Read MoreAdvertising Effectiveness For Prompting Social Interactions With Brands, May 2013 [CHART]
Respondents reported being most likely to notice brand-related social accounts in online banner ads (27.2%), but a relatively high number also notice them in TV (24.1%) and print (21.1%) ads.
Read More