Online Behavior
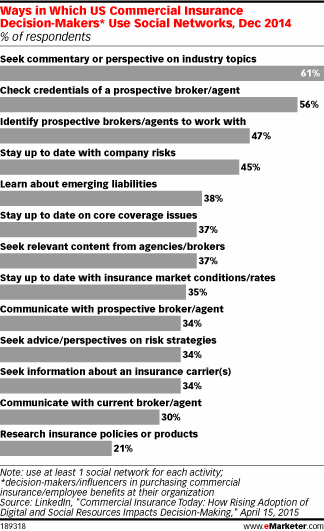
How Commercial Insurance Decision-Makers Use Social Media
Commercial insurance decision-makers frequently turn to brokers/agents when it comes time to purchase.
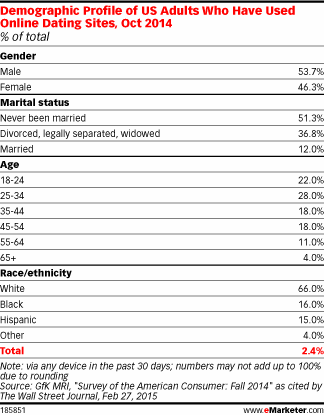
Read MoreDemographics Of Online Daters, October 2014 [TABLE]
The number of US adults searching for that special someone online has more than doubled over the past five years, from 2.7 million in 2009 to 5.6 million in 2014.
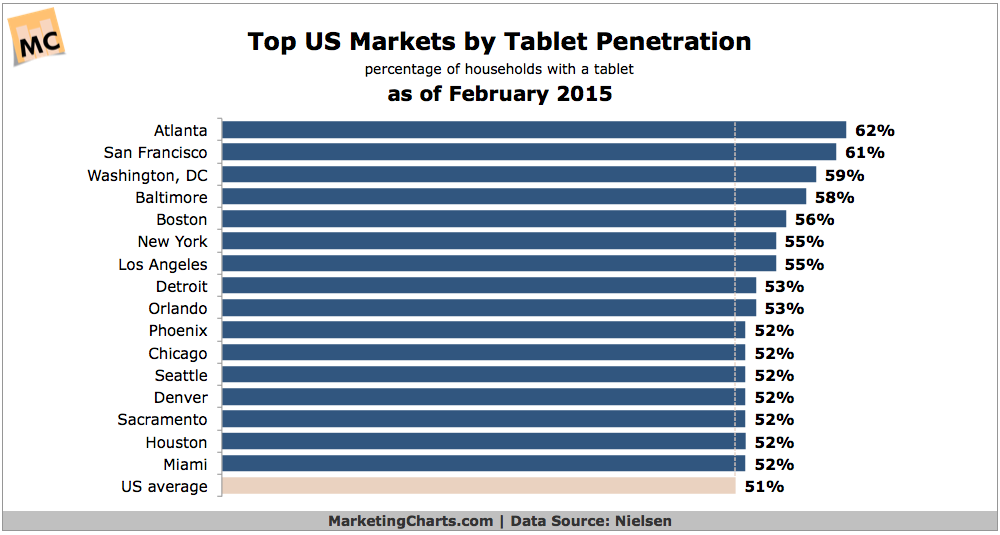
Read MoreTop US Markets By Tablet Penetration [CHART]
Tablet penetration has reached 51% of US households as of February, up 13% points year-over-year.
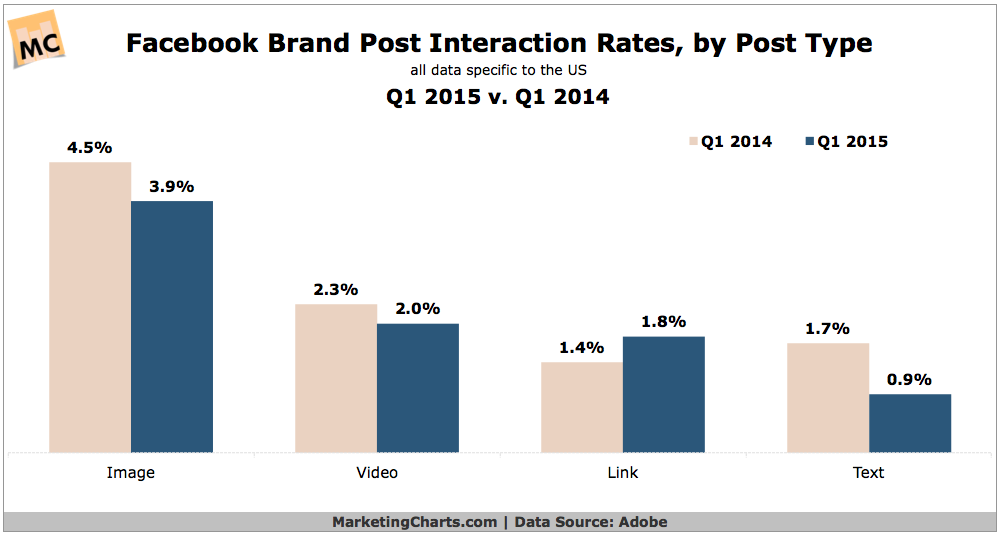
Read MoreFacebook Brand Post Interaction Rates, 2014 vs 2015 [CHART]
Algorithm changes enacted by Facebook in Q1 led to interaction rate declines across most post types.
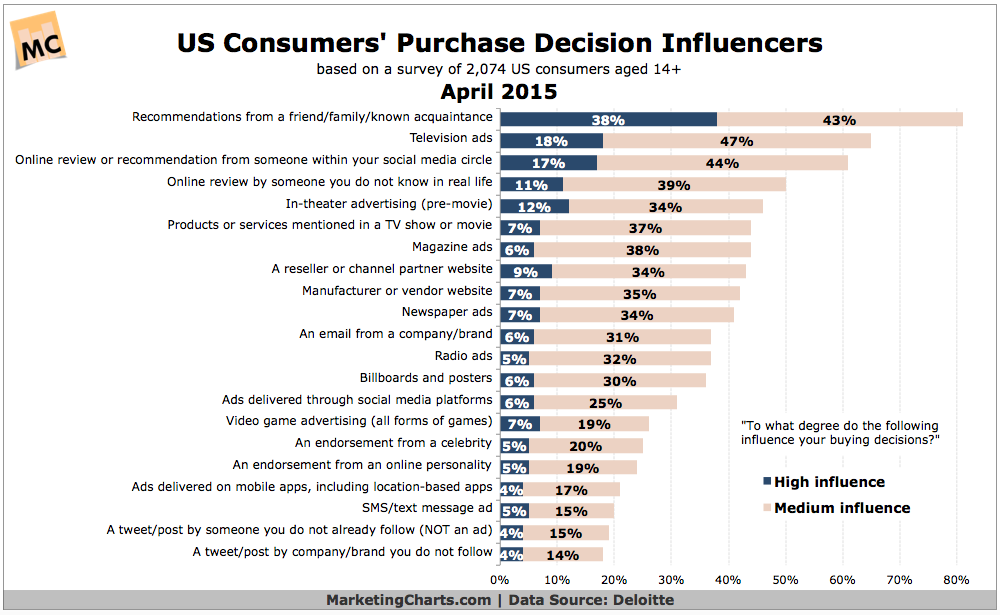
Read MoreTop Influences Over US Consumers' Purchase Decisions, April 2015 [CHART]
When it comes to influencing consumers’ purchases, word-of-mouth continues to outperform all paid media.
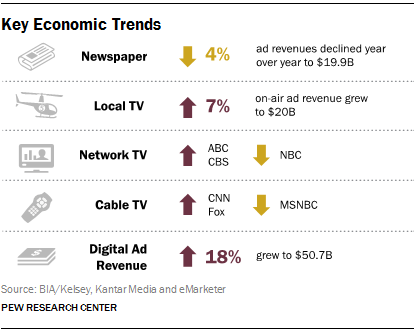
Read MoreNews Media Economics Trends [INFOGRAPHIC]
Newspaper ad revenue declined another 4% year over year, to $19.9 billion – less than half of what it was a decade ago.
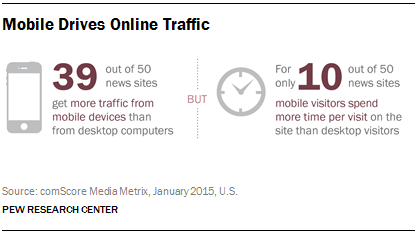
Read MoreMobile News Traffic [INFOGRAPHIC]
At the start of 2015, 39 of the top 50 digital news websites have more traffic to their sites and associated applications coming from mobile devices than from desktop computers.
Read MoreMeet The Facebook Moderators [INFOGRAPHIC]
This infographic by WhoIsHostingThis takes a look at Facebook moderators and what they do.
Read MoreThe Google Mobile Search Algorithm [INFOGRAPHIC]
This infographic from Sumall illustrates some of the details of Google’s mobile search algorithm change that favors mobile-friendly websites for mobile search visibility.
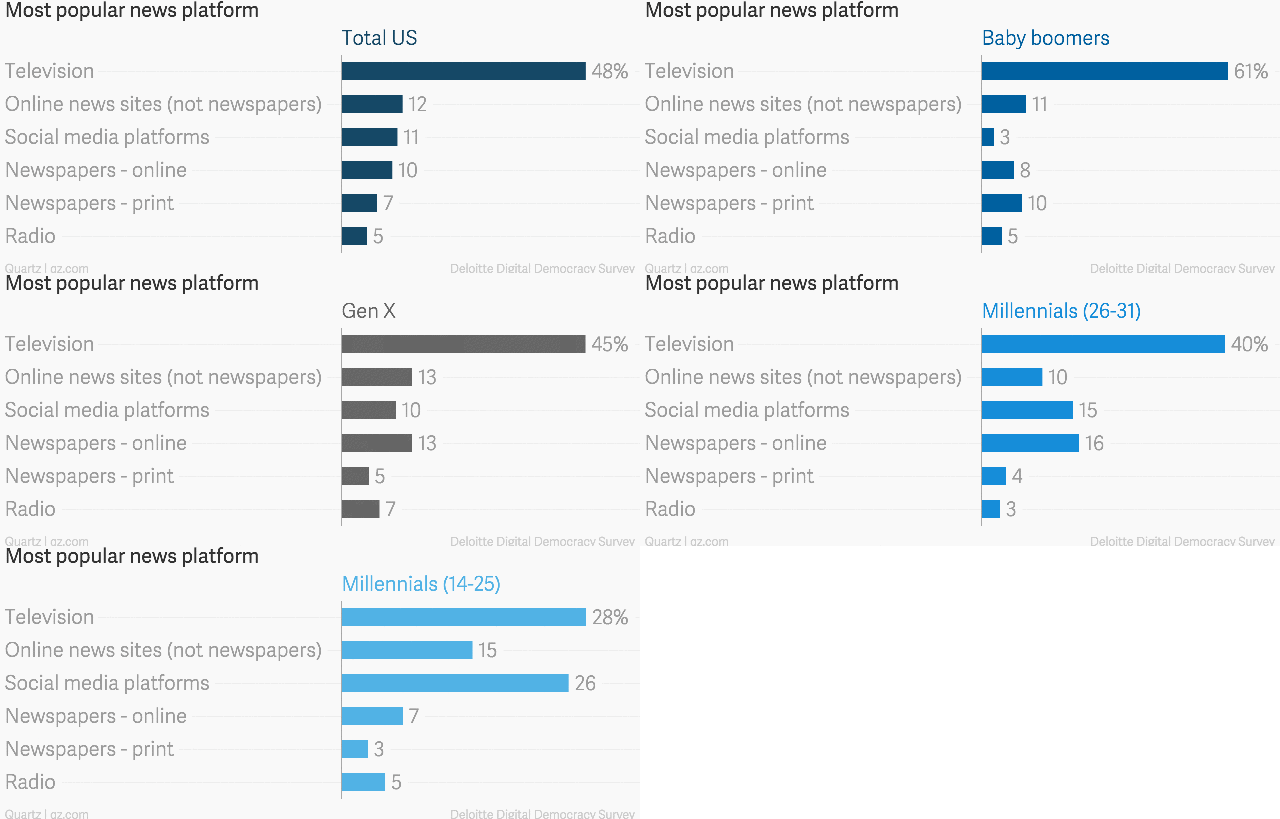
Read MoreMost Popular Sources Of News By Generation [CHART]
Most Popular Sources Of News: The younger you are, the more likely you’ll turn to social media for your news.
Read More