Online Behavior
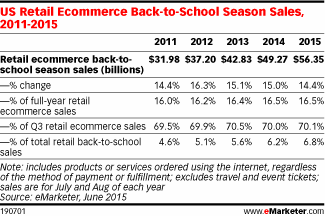
Back-To-School eCommerce Sales, 2011-2015 [TABLE]
Back-To-Scheel eCommerce sales: US retail sales will grow a relatively strong 4.6% during the core back-to-school shopping months of July and August 2015.
Read MoreGamification [INFOGRAPHIC]
This infographic from eLearning Industry illustrates the current state of gamification.
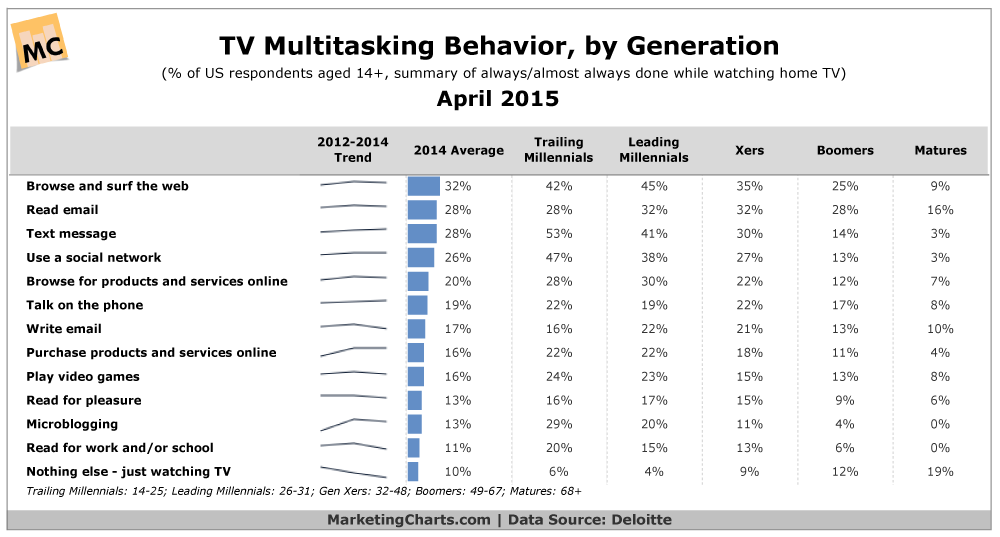
Read MoreTV Multitasking By Generation, April 2015 [TABLE]
9 in 10 Americans age 14 and older claim to always or almost always multitask while watching TV, up from 81% a couple of years ago.
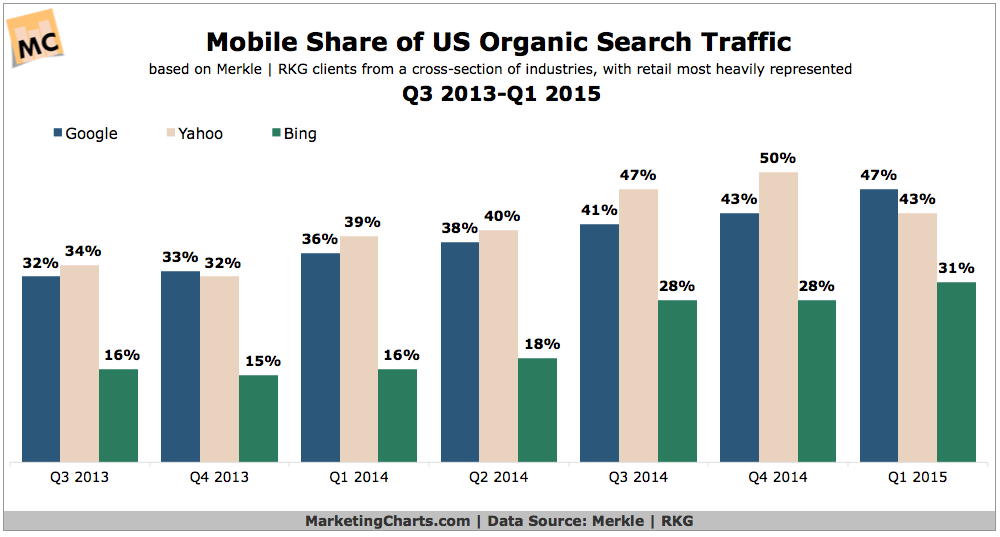
Read MoreMobile Share of US Organic Search Traffic, 2013-2015 [CHART]
Mobile has grown to account for an estimated 45% share of US organic search traffic in Q1.
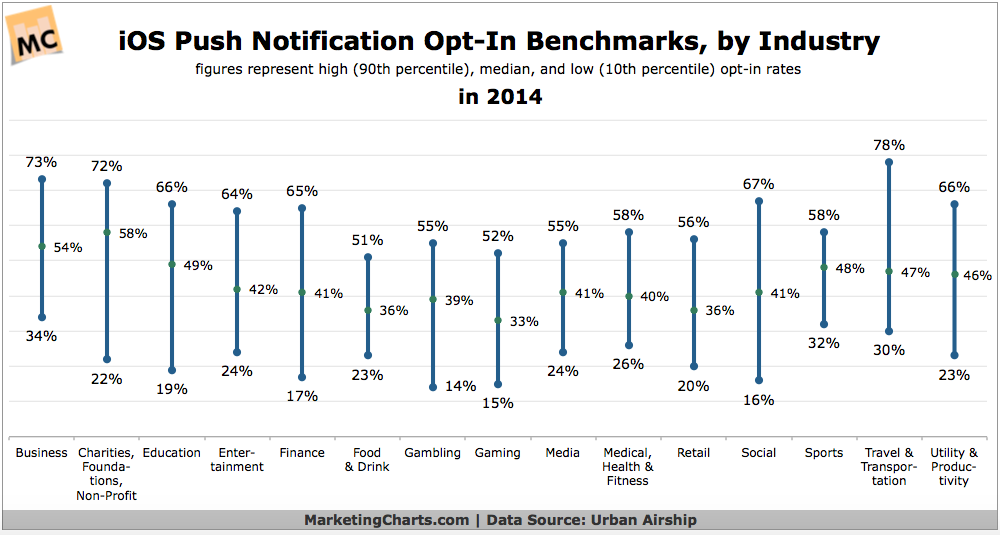
Read MoreApp Notification Opt-in Benchmarks By Industry, 2014 [CHART]
Mobile applications examined by Urban Airship across 15 industries had a median push notification opt-in rate of 42% in 2014.
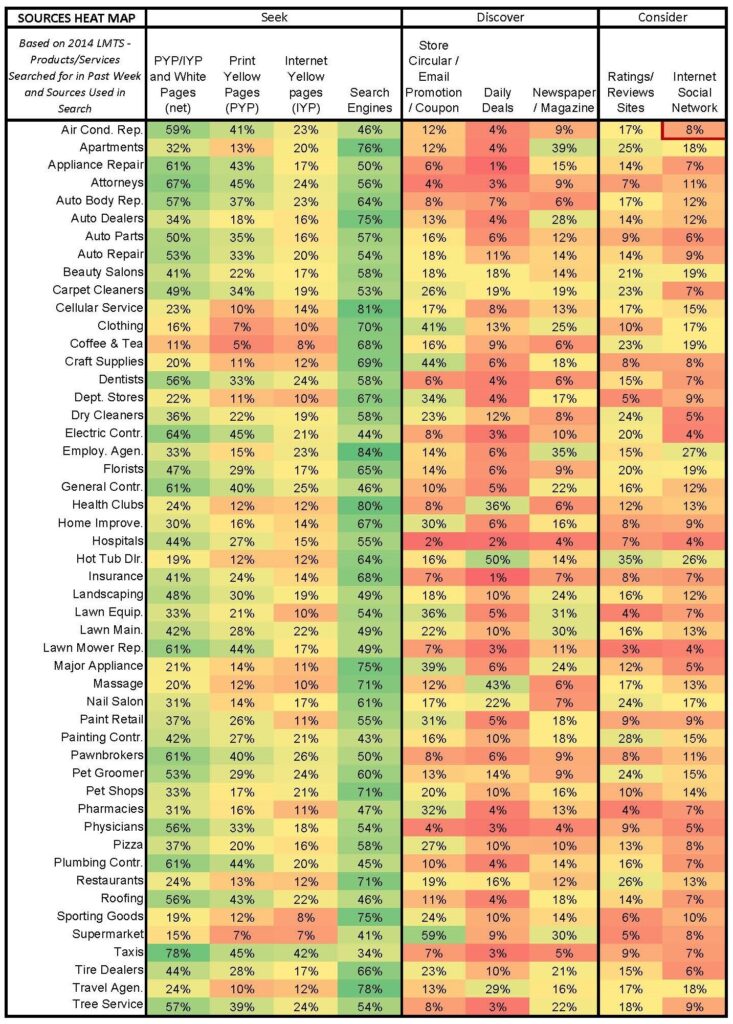
Read MoreChannels Used To Find Local Business Information [HEATMAP]
This year’s Local Search Association Local Media Tracking Study gauged how consumers use different media channels based on business category.
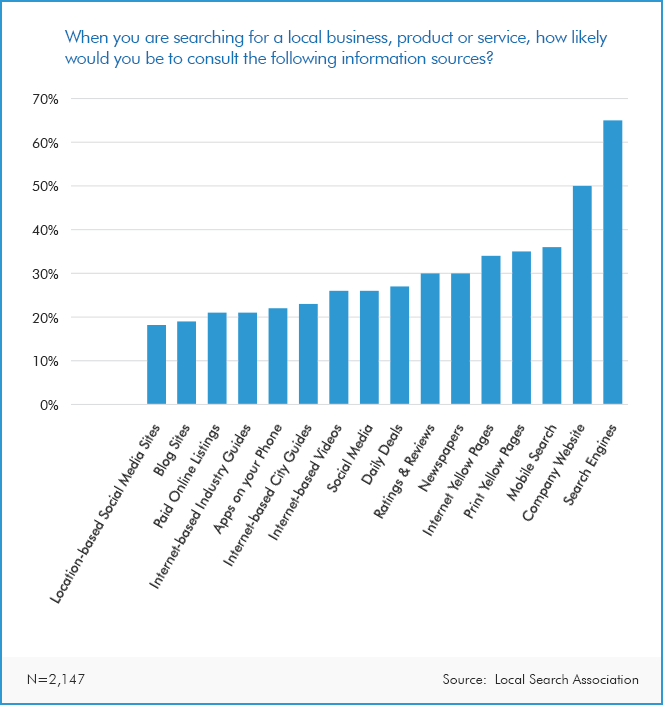
Read MoreSources For Local Business Information [CHART]
While search engines are leaders in the way that consumers look for local businesses and services, other media platforms and competition cannot be ignored.
Read MoreFacebook Organic Reach [INFOGRAPHIC]
This infographic by Quicksprout illustrates ways you can improve your content’s organic reach in Facebook.
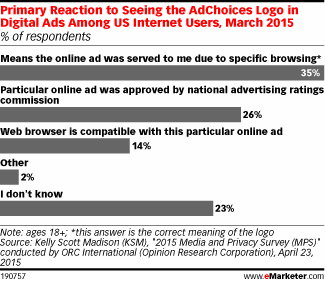
Read MoreBrand Awareness Of AdChoices, March 2015 [CHART]
74% were not familiar with the campaign supporting AdChoices brand awareness.
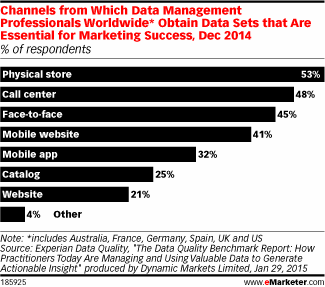
Read MoreEssential Data Sets For Marketing Success, December 2014 [CHART]
Econsultancy found that the most common use of data modeling was for attribution, among both client-side marketers and agency professionals worldwide.
Read More