Online Behavior
Keyword Research [INFOGRAPHIC]
This infographic illustrates the complex practice that is keyword research and search engine optimization.
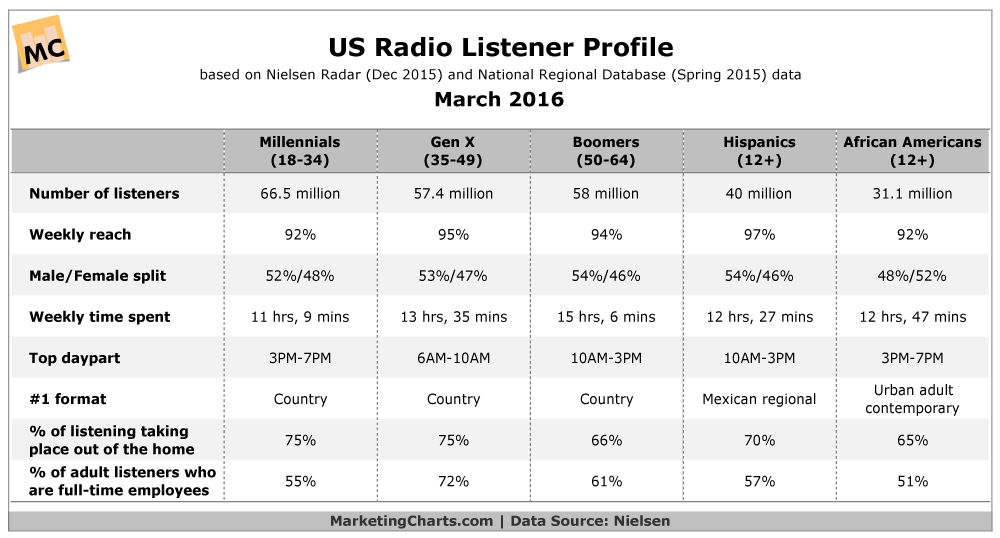
Read MoreRadio Listeners' Habits By Generation & Ethnicity [CHART]
With 93% of US adults listening to radio on a weekly basis, radio is the leading reach platform.
Read MoreVideo Marketing Statistics [INFOGRAPHIC]
Including a video in an email increases the click-through rate by 200-300 percent. This statistic and 30 more are included in this infographic from Hyperfine Media that illustrates the many ways video can be used for marketing.
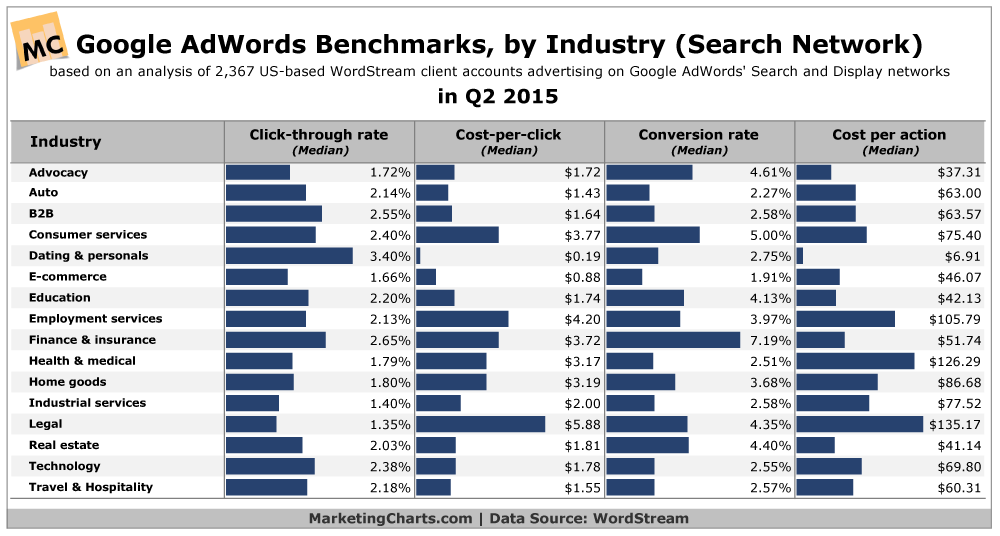
Read MoreGoogle AdWords Benchmark Metrics By Industry [CHART]
The median click-through rate (CTR) in AdWords across industries is 1.91% on the search network.
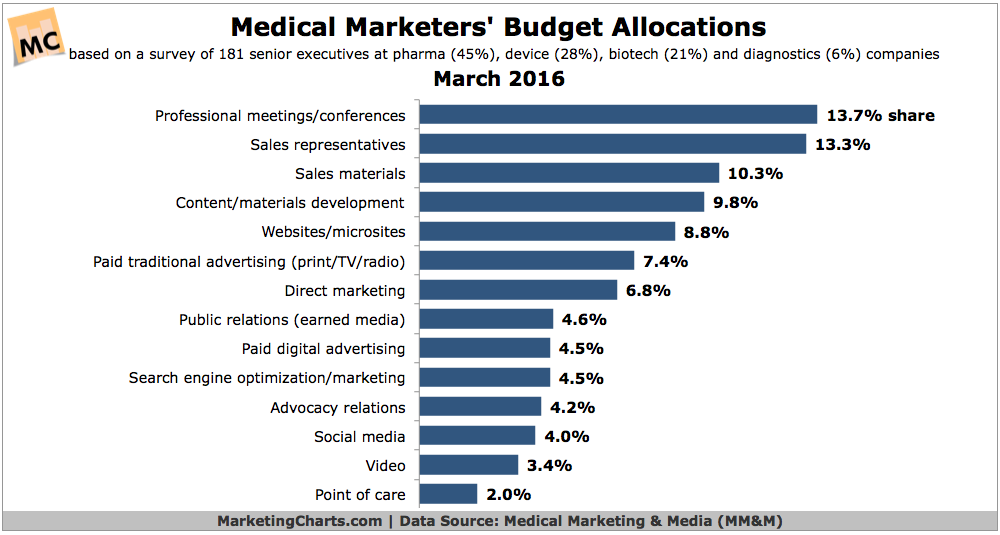
Read MoreBudget Allocations For Medical Marketing [CHART]
Professionals meetings and conferences occupy the largest share (13.7%) of medical marketing budgets.
Read MorePerfect Social Media Posts [INFOGRAPHIC]
This infographic from Quick Sprout illustrates some of the elements that go into creating create posts for YouTube, Facebook, Twitter, Pinterest, and Google+.
Read MoreConsumers' In-Store Mobile Activities [CHART]
Mobile devices and other digital technologies continue to have a growing impact on retail, including in-store shopping.
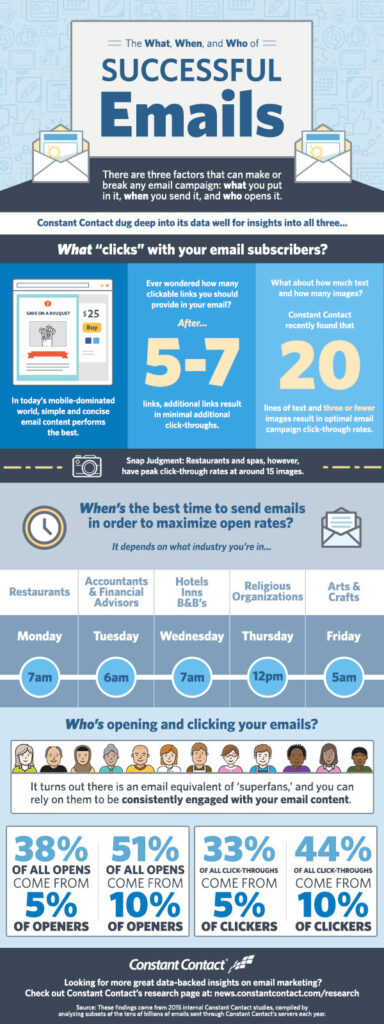
Read MoreElements Of Successful Email Campaigns [INFOGRAPHIC]
This infographic highlights research from email marketing service provider Constant Contact illustrating the elements of successful email campaigns.
Read MoreSnapchat Growth Among Millennials & Gen Xers [CHART]
Snapchat is getting more popular with older demographics, particularly the 25-34 and 35-44 age groups.
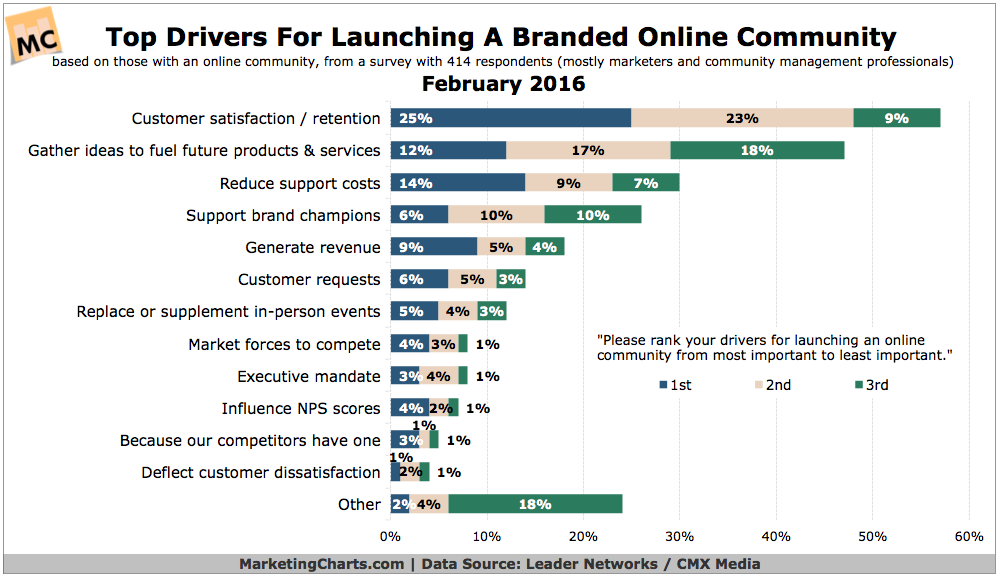
Read MoreTop Reasons Brands Launch Online Communities [CHART]
Customer satisfaction and retention ranks as the most important driver for launching a branded online community, among both companies that already have launched a community and those that are considering doing so.
Read More
