Online Behavior
US Retail mCommerce Sales By Device, 2011-2016 [CHART]
This year, US consumers will spend $24 billion shopping on their tablets, and that figure will nearly double by 2015.
Read MoreFrequency Of Mobile Social Network Visits, July 2011 & March 2012 [CHART]
In the US, 60% of smartphone users surveyed by Google in March 2012 reported that they visited mobile social networks daily, up from 54% in July 2011.
Read MoreDevices On Which People Access Social Media, 2011 & 2012 [CHART]
There is no question that social media has gone mobile, as more and more consumers access their accounts via smart phones and tablets.
Read MoreRetail mCommerce, 2011-2016 [CHART]
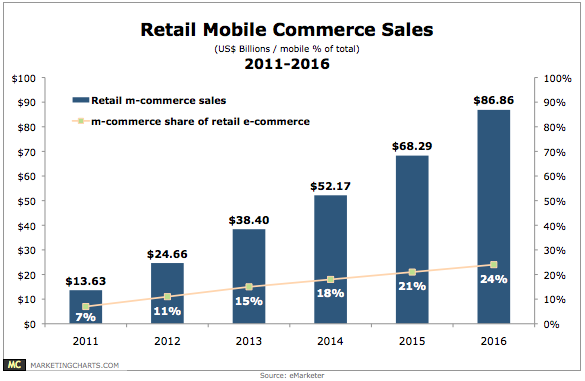
Mobile devices had a strong influence on the 2012 holiday season, and look set to continue that momentum through this year and beyond.
Read MoreUS Retail Search Advertising Metrics For 2012 Holiday Season [TABLE]
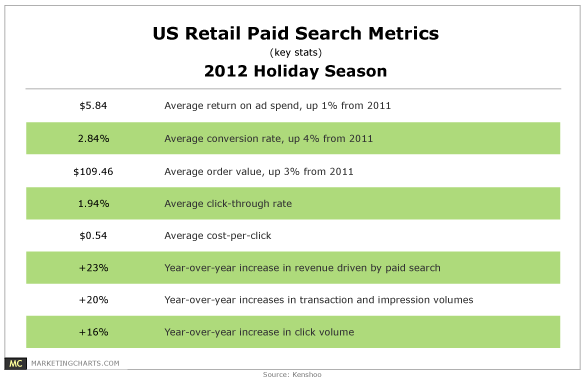
Average return on ad spend crept up 1% from last year to $5.84, while conversion rates increased 4% to 2.84%, and average order value was up 3% to $109.46.
Read MoreDaily Time Spent Social Networking By Demographic, January 2013 [CHART]
Americans aged 18-64 who use social networks say they spend an average of 3.2 hours per day doing so.
Read MoreAmerican Search Advertising Click Behavior by Region & Age, January 2013 [CHART]
22% of online Americans say that they click on search engine ads.
Read MorePercentage Of Web Traffic From Mobile Devices, Q4 2011-Q4 2012 [CHART]
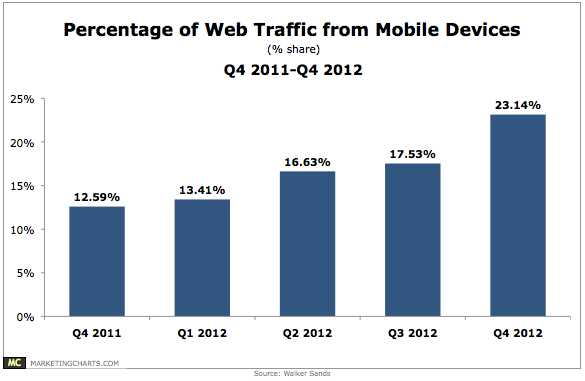
The percentage of website traffic coming from mobile devices jumped from 17.5% in Q3 2012 to 23.1% in Q4 2012.
Read MorePreferred Social Logins, Q4 2012 [CHART]
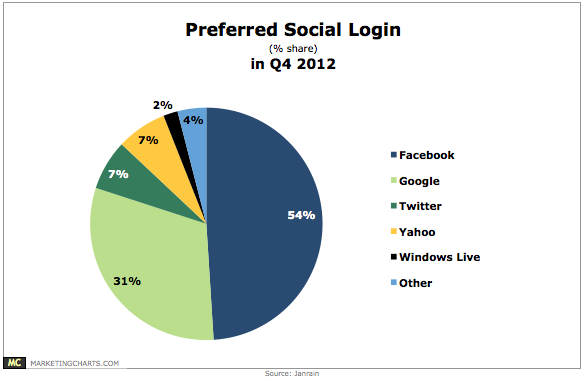
Facebook was once again the leading option in Q4 2012 for social logins.
Read More