Online Behavior
Global Facebook Advertising CPC Rates By Device, December 2012 [CHART]
Cost-per-click on mobile ads was $1.38 vs. 81 cents on desktop, according to Kenshoo Social.
Read MoreConsumer Purchase Decision Information Sources, January 2013 [CHART]
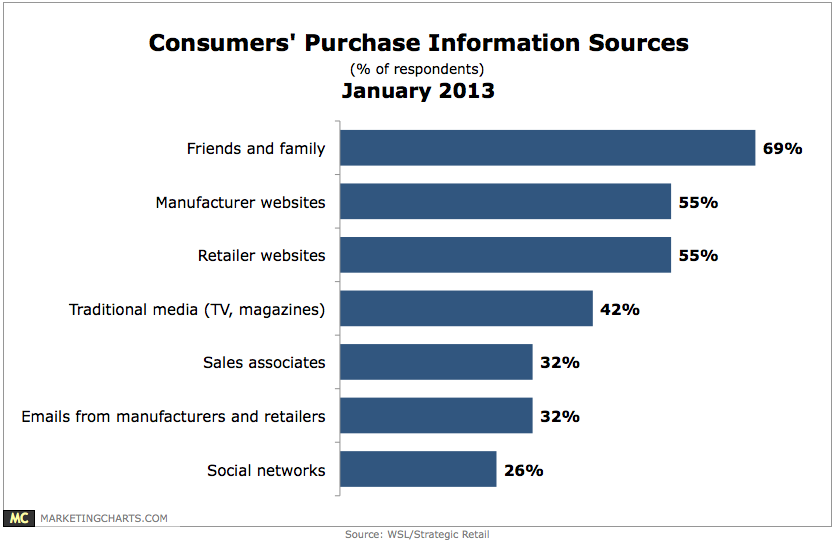
Consumers still look first to their friends and family for advice regarding their purchase decisions.
Read MoreCustomer Insights Via Social Media, January 2013 [CHART]
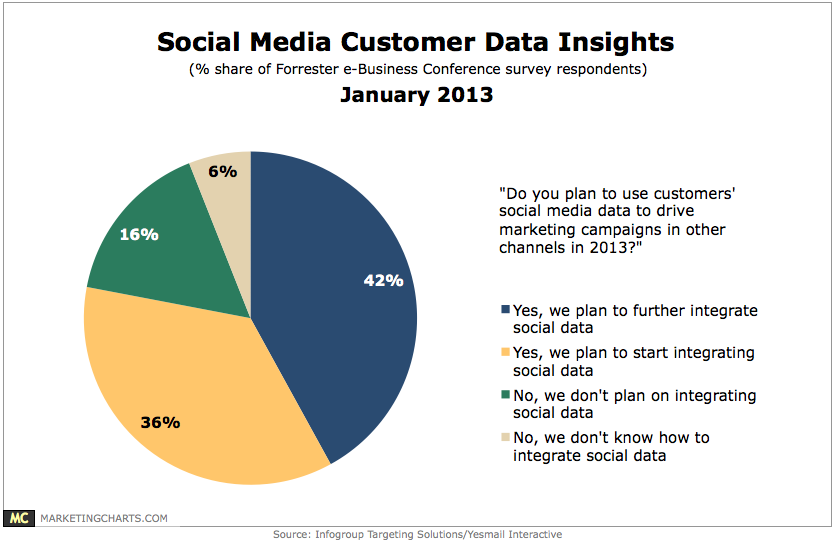
4 in 5 marketers said they plan to use customers’ social media data to drive marketing campaigns in other channels this year.
Read MoreTime Spent Online By Gender & Generation, 2011 vs 2012 [CHART]
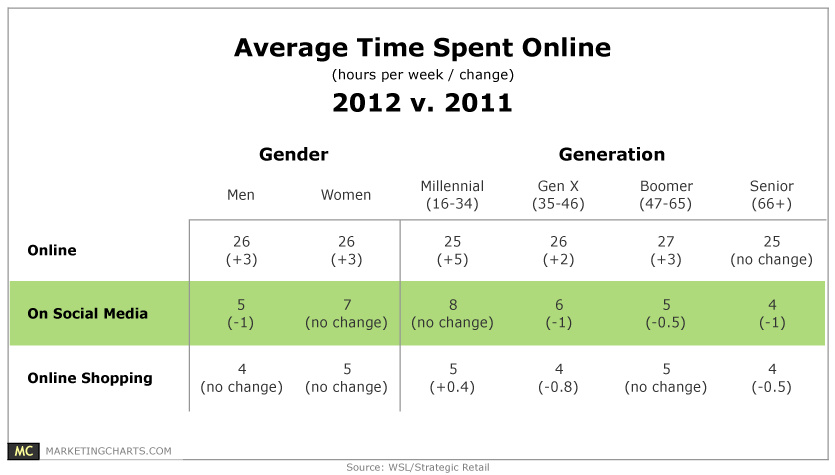
Online Americans spent slightly more than one day a week online last year, increasing their average online time by 3 hours to 26 hours.
Read MoreHoliday eCommerce Traffic Sources, January 2013 [CHART]
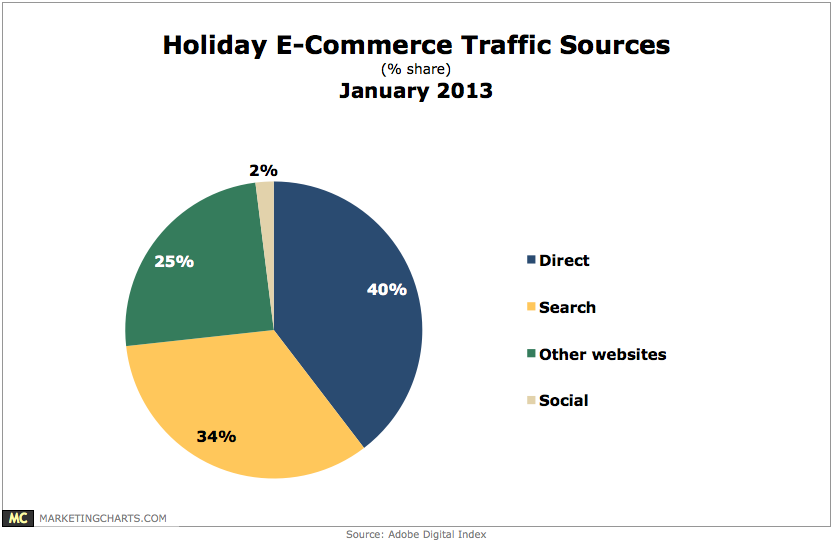
Only 2% of traffic to retailers during the holiday season came from social networks.
Read MoreBrand-Connected Consumers' Attitudes Regarding Social Feedback, January 2013 [CHART]
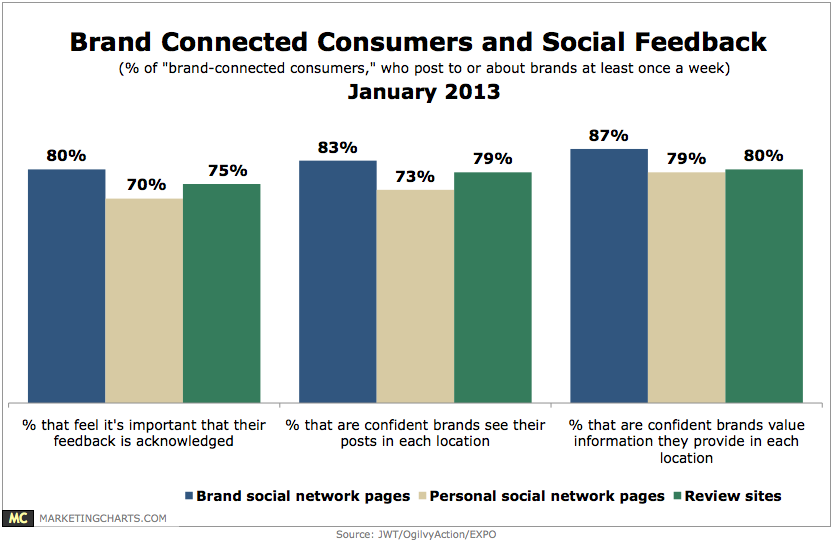
8 in 10 consumers digitally engage with brands, while one-quarter are brand-connected consumers who both post to and about brands online at least once a week.
Read MoreMobile Use By Luxury Brand Shoppers, January 2013 [CHART]

59% of luxury brand shoppers say they’ve used mobile to interact with a company.
Read MoreMobile Search Engine Traffic Market Share, Q4 2012 [CHART]
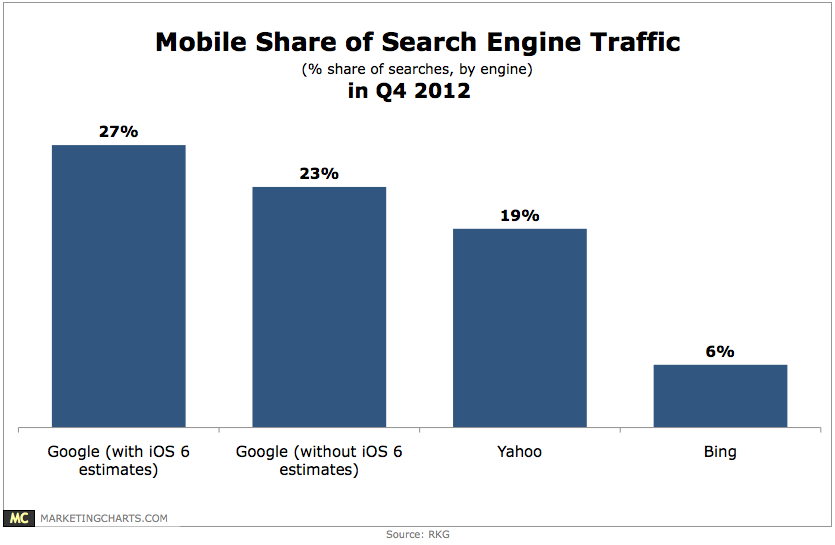
Mobile activity on Google far outpaced Yahoo and Bing.
Read More
Americans' Engagement With Brands On Social Networks By Demographic, January 2013 [CHART]
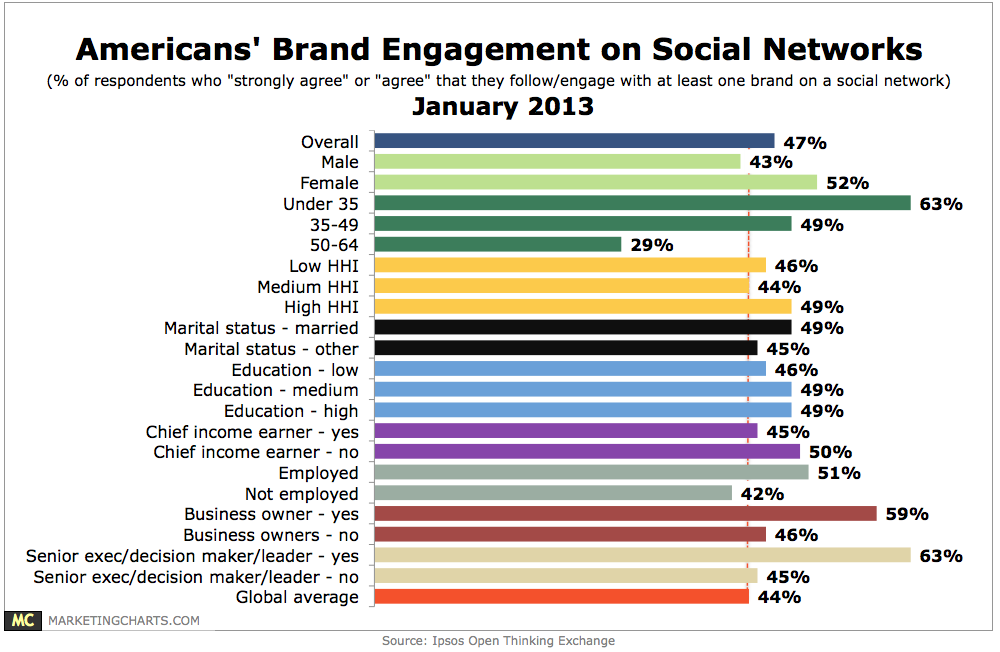
47% of Americans agree that they follow or engage with at least one brand on a social networking site.
Read More