Online Behavior
Online Travel Spending, 2012 [TABLE]
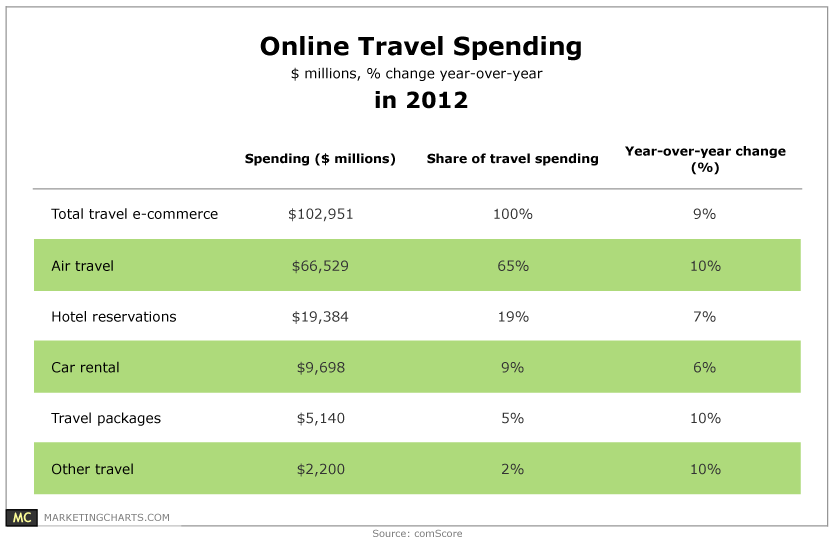
US travel e-commerce sales exceeded $100 billion for the first time last year, reaching $103 billion.
Read MoreGetting Facebook Shares [INFOGRAPHIC]
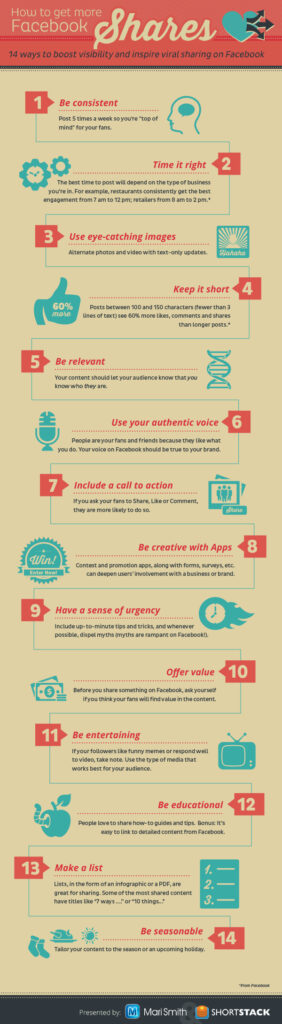
This infographic by Mari Smith illustrates fourteen tactics to inspire people to share your content on Facebook.
Read MoreDemographics Of Online Health Care Diagnosis Seekers, September 2012 [TABLE]
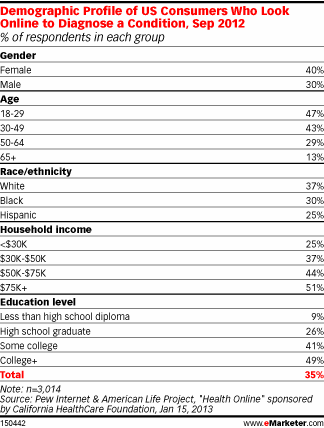
40% of women and 30% of American men relied on the Internet to diagnose medical conditions.
Read MoreTypes Of Health Information Sought Online By Generation & Gender, September 2012 [TABLE]
16% of internet users said they had searched for information on a drug they had seen advertised.
Read MoreOnline Health Seeker Demographics, September 2012 [TABLE]
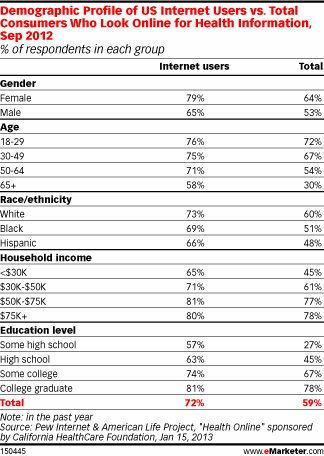
72% of US internet users and 59% of the general population had looked online for health information within the past year.
Read MoreImmediate vs. Long-Term Transformational Marketing Data, November 2012 [TABLE]
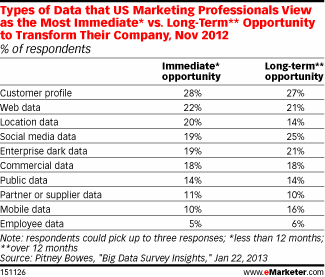
Marketers most commonly saw Immediate Opportunity (defined as useful within the next 12 months) for customer profile data, web data and location data.
Read More
Mobile Email Opens, 2010-2012 [CHART]
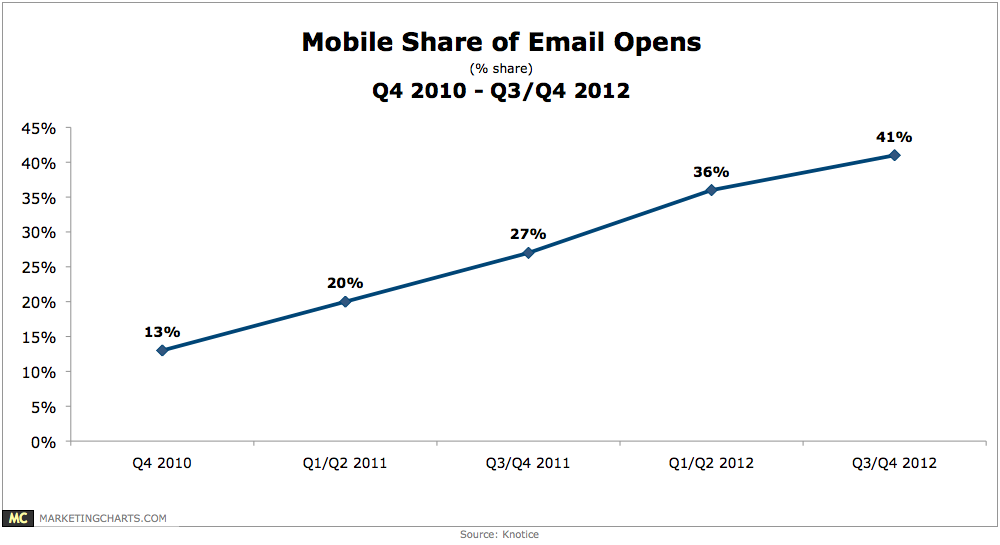
The share of email opens occurring on a mobile device keeps growing, climbing to 41% in the second half (H2) of 2012 from 36% in H1.
Read MoreSocial Network Adoption By World's Top 100 Brands By Site, November 2012 vs February 2013 [CHART]
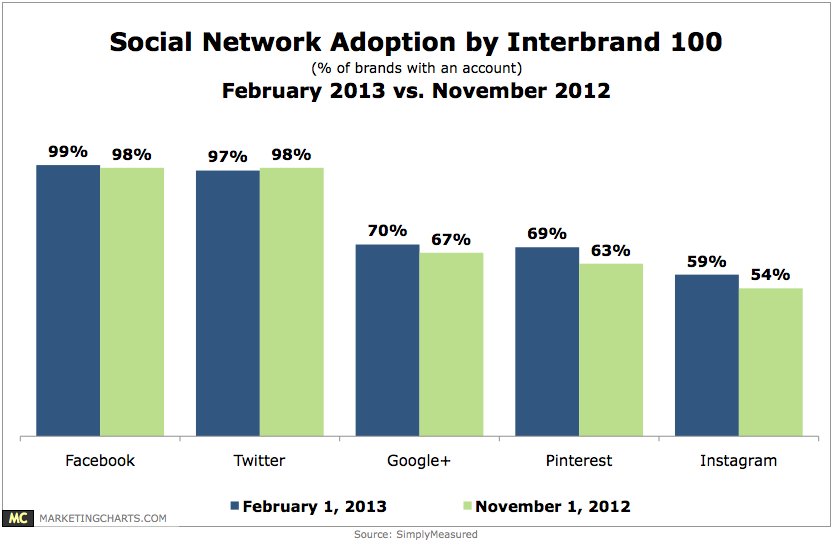
As of February 1, 69 of the Interbrand 100 had a Pinterest account and 59 an Instagram account, up from 63 and 54, respectively, 3 months earlier.
Read MoreAppeal Of Money-Saving Offers Among Social Brand Fans Worldwide, February 2013 [CHART]
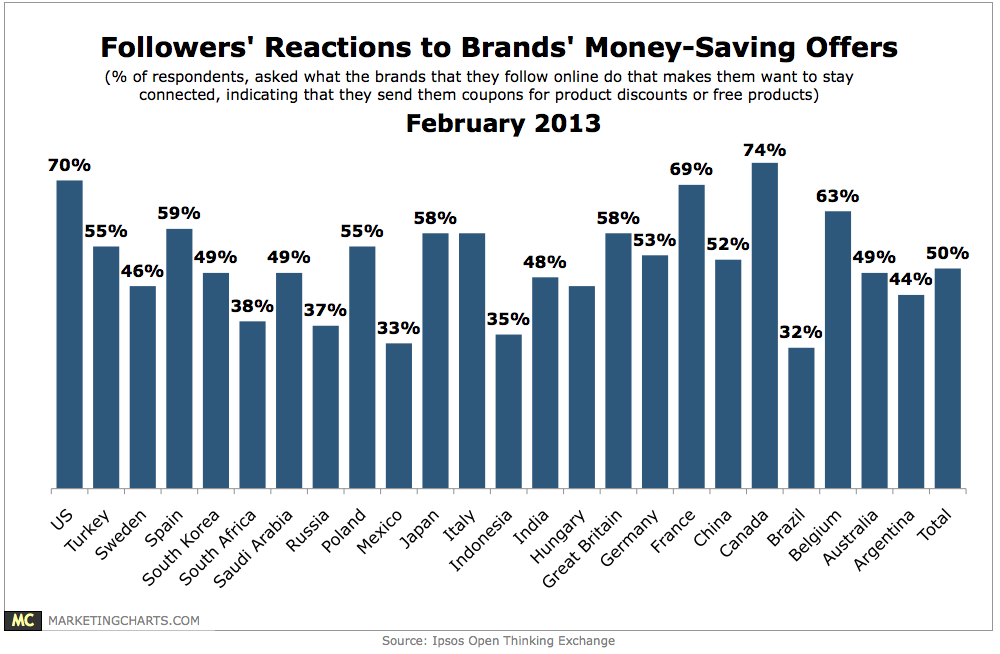
7 in 10 Americans who follow brands online say that they want to stay more connected to those brands when they offer them coupons, discounts and free products.
Read More