Online Behavior
Online Video Ad Views, December 2011 – January 2013 [CHART]
Online video ad views fell from a peak of 11.3 billion in December 2012 to just 9.1 billion last month, a 19.5% decline.
Read MoreMobile Operating System Market Share, 2011 vs 2012 [CHART]
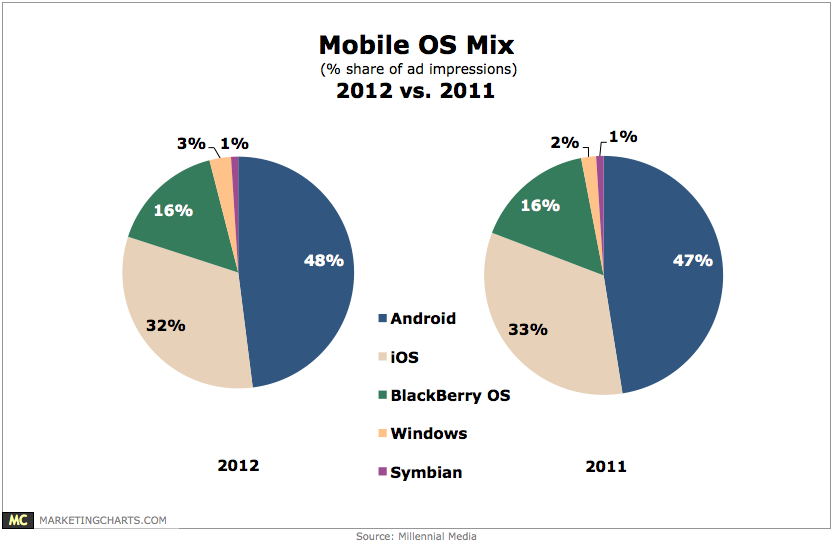
With 75% share of total ad impressions, the smart phone share grew by 7% points from 2011.
Read MoreSearch Advertising Cost Per Click By Device, Q4 2011 – Q4 2012 [TABLE]
US advertisers will increase mobile search ad spending 80.6% this year to $3.54 billion, up from $1.99 billion in 2012.
Read MoreSearch Ad Spending Share By Device & Search Engine, Q4 2011 – Q4 2012 [TABLE]

On desktops, Google captured more than four-fifths of search spending in the last quarter measured.
Read MoreSearch Advertising Click Share By Device, Q4 2011 – Q4 2012 [CHART]
The share of paid clicks coming from smart phone and tablet devices nearly doubled between Q4 2011 and Q4 2012.
Read MoreSearch Volume & Social Chatter For Best Picture Oscar Nominees [CHARTS]

Online behavior for Amour, Argo, Beasts of the Southern Wild, Django Unchained, Les Misérables, Life of Pi, Lincoln, Silver Linings Playbook & Zero Dark Thirty.
Read MoreInteraction With Brands Via Social Media By Generation, February 2013 [CHART]
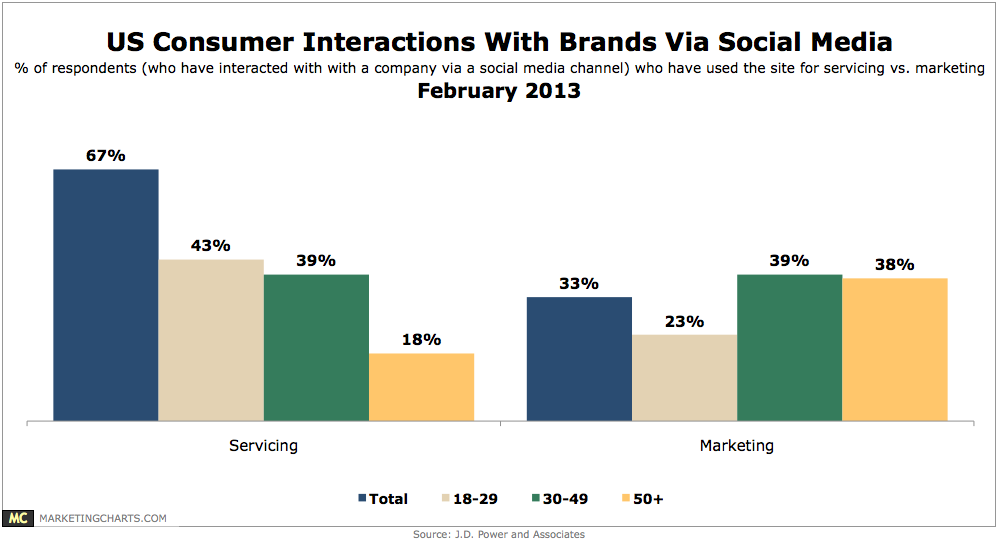
67% of people have have interacted with a company via a social media channel for servicing versus 33% who have done so for marketing.
Read MoreFacebook Pages Benchmarks [INFOGRAPHIC]
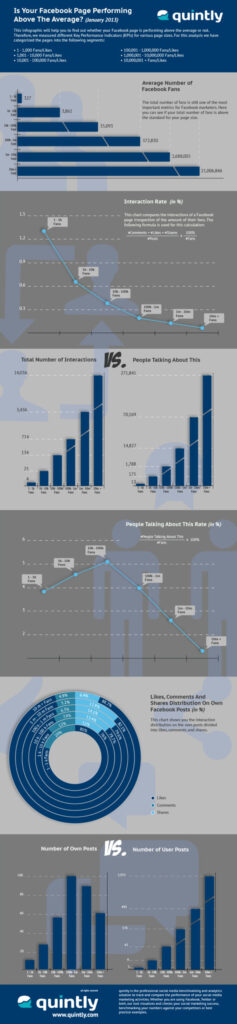
This infographic by Quintly analyzes Facebook metrics to provide benchmarks for pages of all sizes.
Read MoreTop Channels For Local Marketing Success, February 2013 [CHART]
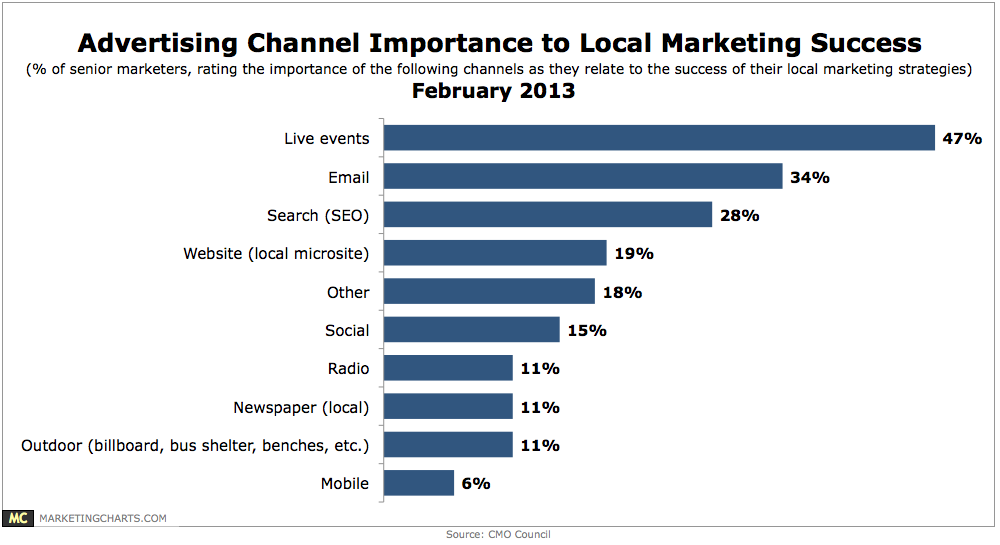
Senior marketers are lukewarm about mobile’s importance to their local marketing agendas.
Read MoreVideo Engagement: Facebook Uploads vs. YouTube Links, January 2013 [CHART]
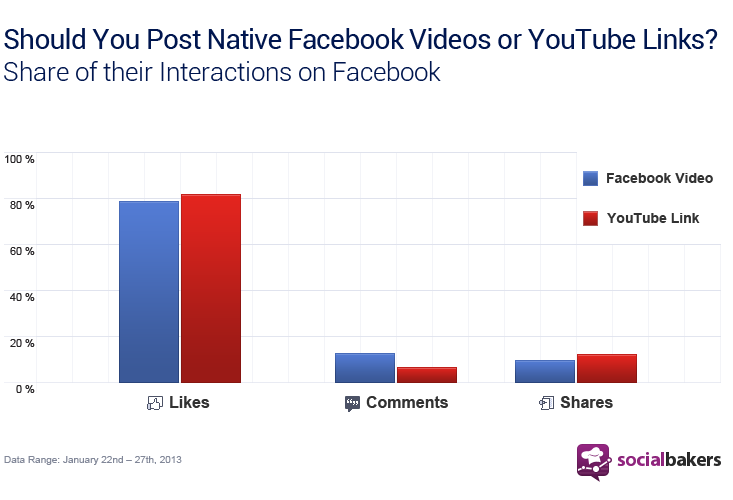
Facebook videos achieved a 40% higher Engagement Rate (0,25%) than YouTube links (0,151%) in the studied period.
Read More