Online Behavior
Chinese eCommerce [INFOGRAPHIC]
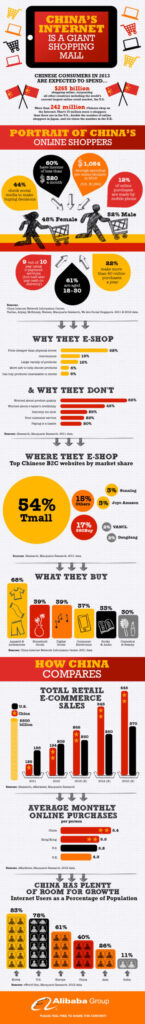
Alibaba expects e-commerce in China to reach $265 billion this year, up from roughly $194 billion in 2012.
Read MoreMobile Enterprise [INFOGRAPHIC]
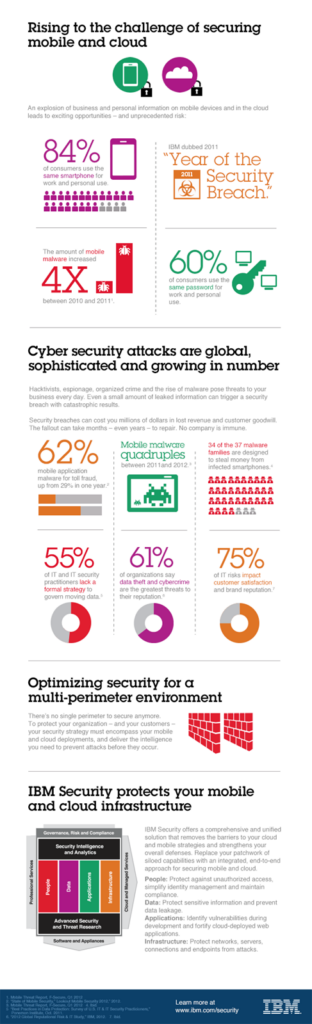
While 84% of consumers now use their personal smart phones for work, mobile malware has increased more than four times since 2010.
Read MoreTop Brand Instagram Adoption [STUDY]
With 90 million monthly active users, 40 million photos per day, and 8,500 likes per second, Instagram has now managed to attract 59% of the world’s top brands.
Read MoreAmerican Millennial Teens' Attitudes Toward Offline vs. Online Advertising, February 2013 [CHART]
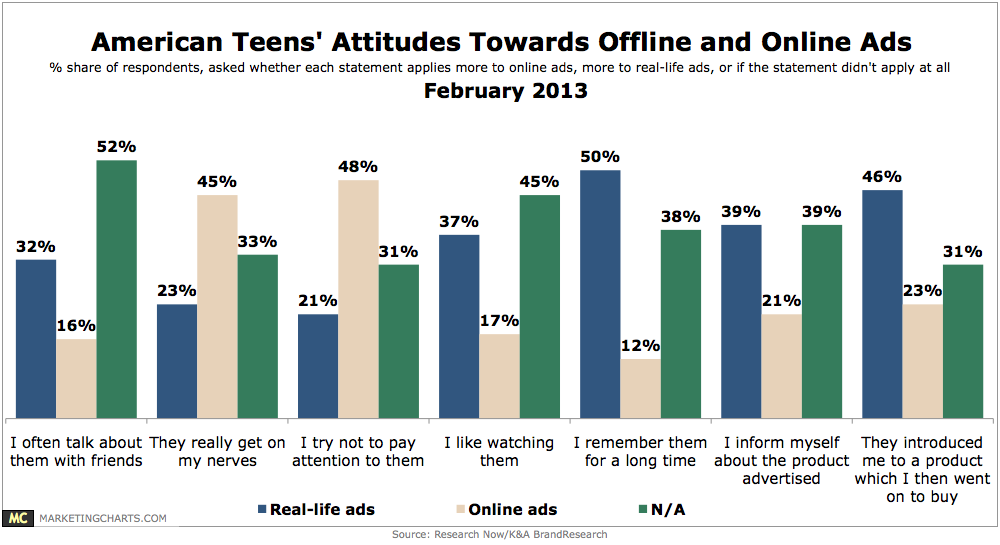
American teens strongly favor offline over online ads across a variety of measures.
Read MorePercent Of Brand-Owned Organic Search Results Worldwide By Category, 2012 [CHART]

Twenty-four of 57 brands analyzed owned more than 50% of their first-page search results.
Read MoreSearch Engine Marketing Results For Luxury Hotels Worldwide, December 2012 [CHART]
46% of first-page organic search results for worldwide upscale hotel brand keywords belonged to brands themselves, as opposed to OTA sites or TripAdvisor links.
Read MoreTop Metrics For Evaluating Influencers, December 2012 [CHART]
Facebook friends and Likes and Twitter followers were among the most important metrics used by brands when evaluating these individuals.
Read MoreMost Influential Sites On Purchase Decisions, December 2012 [CHART]
86% of influencers blogged regularly, and more than half operated between two to five blogs.
Read MoreConsumer Attitudes Worldwide Toward Mobile Advertising, February 2013 [CHART]
This chart from Nielsen is a snapshot of consumer attitudes worldwide toward mobile advertising.
Read MoreTime Spent On Mobile vs. PC By Website Type, April 2013 [CHART]
This graphic from comScore illustrates time spent on the Internet using a PC vs. mobile.
Read More