Online Behavior
Tablet Traffic To US Websites Of Select Industries, January 2013 [CHART]
The top-performing retailer site studied got 13% of internet traffic from tablets.
Read MoreUS Smart Phone Website Traffic To Select Industry Websites, January 2013 [CHART]
The top-performing site that got the greatest share of traffic from smart phones was in the media and entertainment category.
Read MoreTime Spent On US Websites By Select Industries, January 2013 [CHART]
The top-performing media and entertainment site kept users on the site for about 12 minutes per visit.
Read MoreTop Multi-Platform Properties, February 2013 [TABLE]
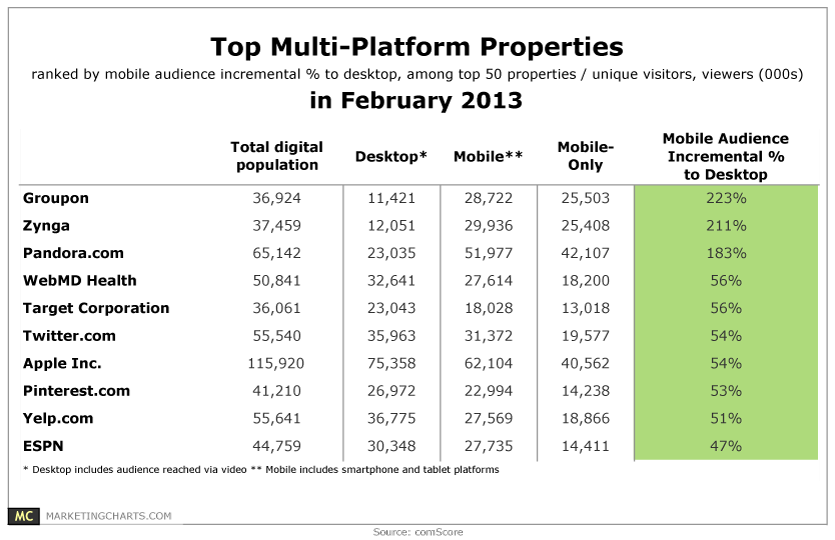
Including mobile audience counts into a web property’s total audience makes a significant difference to reach and rankings.
Read MoreWhere People Use Mobile Travel Sites & Apps, March 2013 [CHART]
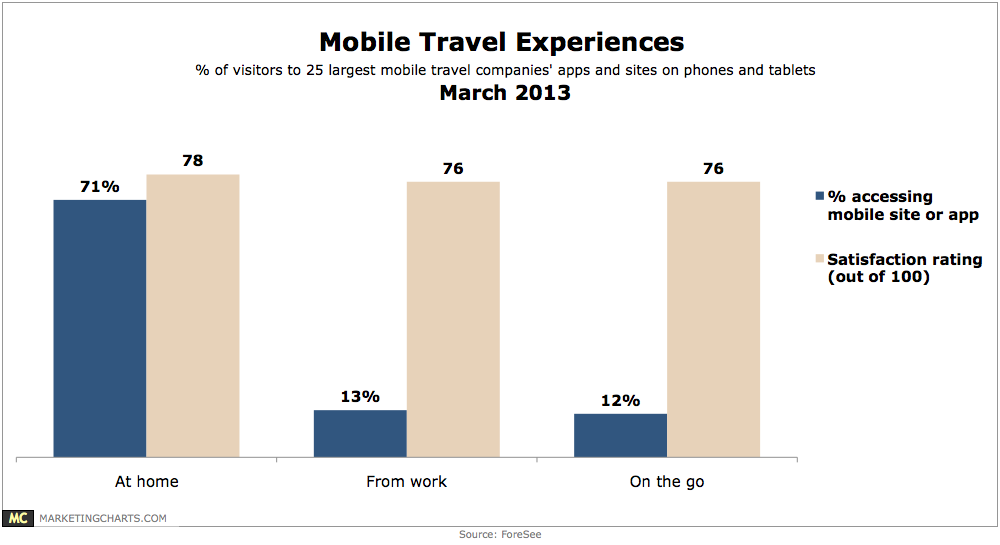
71% of consumers accessed travel companies mobile websites or apps from home, compared to 13% who accessed from work and just 12% who visited them on-the-go.
Read MoreMobile Website vs. App Traffic, March 2011-March 2013 [CHART]
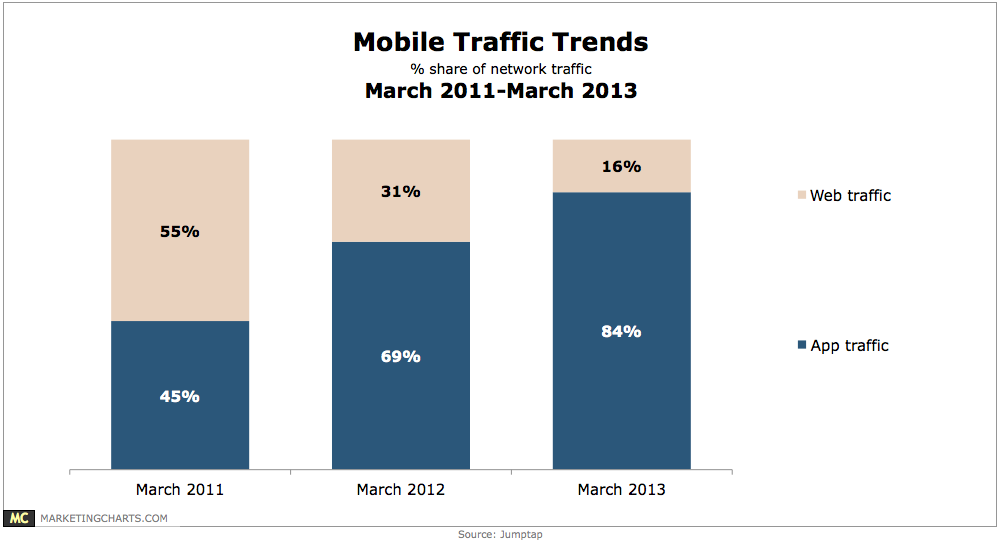
85% of mobile application users prefer them to the mobile web, primarily as a result of convenience and speed.
Read MoreUS Online Buyers By Generation, 2010-2016 [TABLE]
eMarketer’s estimate of online buyer penetration among internet users puts the figure at 63.7% for the 65-and-older population by the end of 2013.
Read MoreVideo Consumption By Platform & Generation, Q4 2012 [TABLE]
In Q4 2012, seniors averaged 220 hours and 55 minutes per month watching traditional TV.
Read MoreAmerican Seniors' Technographics [CHART]
Although a majority of seniors have mobile phones, comparatively few have smart phones.
Read MoreBeyond Social Media: Ford Stung by Agency, Fining Bloggers & HBO Go Unleashed [PODCAST]

This week’s highlights: Ford Stung by Agency; Social Tiger Haters; NRA’s Robocalls; Fining Bloggers; HBO Go Unleashed? Amazon’s Zombies & Reddit’s Five Year Olds & Illustrating Keynotes.
Read More