Online Behavior
Mobile Share Of Online Video Starts, Q4 2011 vs Q4 2012 [CHART]
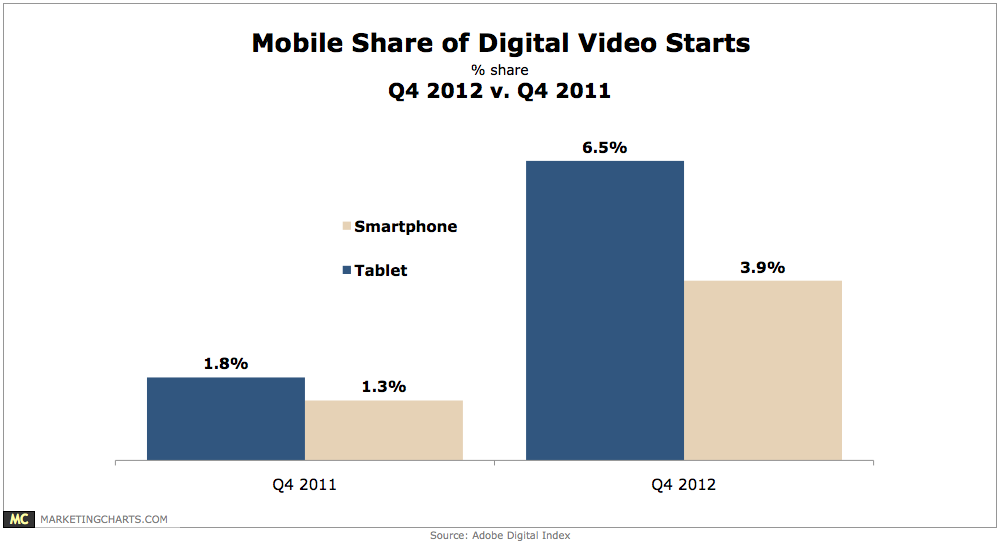
Smart phones and tablets accounted for a combined 10.4% of video starts, more than triple their 3.1% share from just a year earlier.
Read More
American Social Media Users By Race/Ethnicity, 2012-2017 [TABLE]
In 2012, 68.9% of Hispanics were using social networks, compared with 66.2% of the total US population.
Read MoreTime Spent Online By Activity, 2011 & 2012 [TABLE]
On the desktop internet, activity was much more heavily weighted toward social networking, which accounted for 27% of time spent online.
Read MoreTime Spent On Mobile Device Online By Activity, Q1 2013 [TABLE]
US mobile internet users spent the greatest percentage of their mobile web time using email, a 23% share of time spent vs. only 5% of time spent on desktop.
Read MoreDevices Used To Go Online, July 2011-January 2013 [CHART]

On average, 43.5% of participants accessed the internet via a mobile phone each week during the period ending in January 2013, an 8-percentage-point increase over the period ending in July 2012.
Read MoreAmerican Retail eCommerce Sales CAGR By Category, 2012-2017 [CHART]

A mix of larger and smaller online product categories will post the highest CAGRs from 2012 to 2017.
Read MoreAmerican Retail eCommerce Sales By Product Category, 2011-2016 [TABLE]
Computer and consumer electronics, as well as apparel and accessories, account for the bulk of US retail eCommerce sales.
Read MoreAmerican eCommerce Sales, 2011-2017 [CHART]
In 2013, eMarketer estimates US retail ecommerce sales will total $259 billion, a 14.8% annual increase over 2012’s $225.5 billion.
Read MoreAmerican Mobile Buyers By Device, 2011-2017 [TABLE]
In 2013, 79.4 million US consumers, amounting to 51% of digital buyers, will purchase online using a mobile device.
Read More