Online Behavior
Consumers' Pre- & Post-Real Time Marketing Behavior, February 2012 [CHART]
Nearly half of consumers said they would feel more positive after exposure to real-time marketing, while 46% would be more interested in the brand.
Read MoreDaily Time Media Consumption By Media, 2010-2012 [TABLE]
The average daily time spent online reached 3 hours, 7 minutes last year, up from just less than 3 hours in 2011.
Read MoreBrand Engagement On Pinterest, March 15 – April 15, 2013 [CHART]
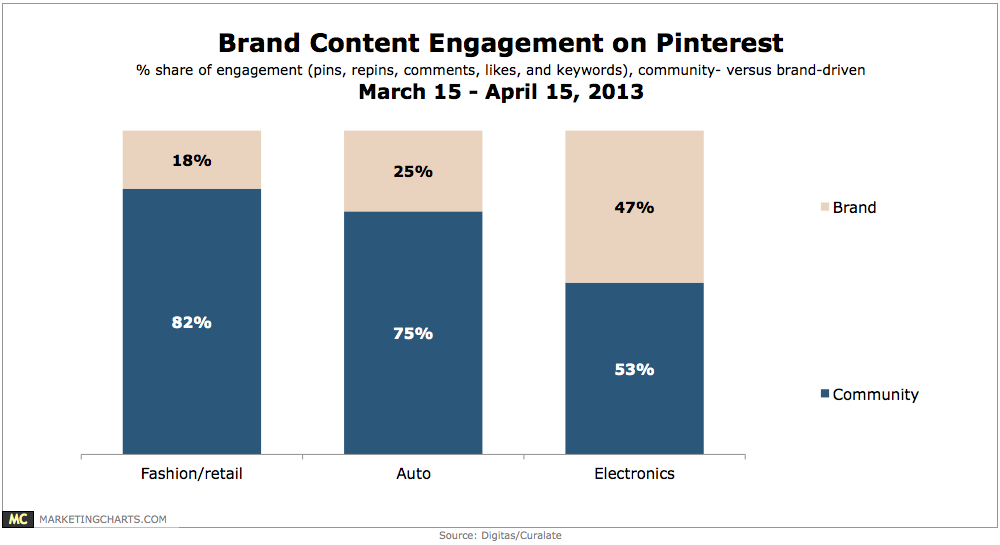
Fashion and retail-related images are most likely to be pinned by the community, with brands pinning only 18% of content.
Read MoreDemographics Of Online Video Viewers By Video Type, May 2013 [TABLE]
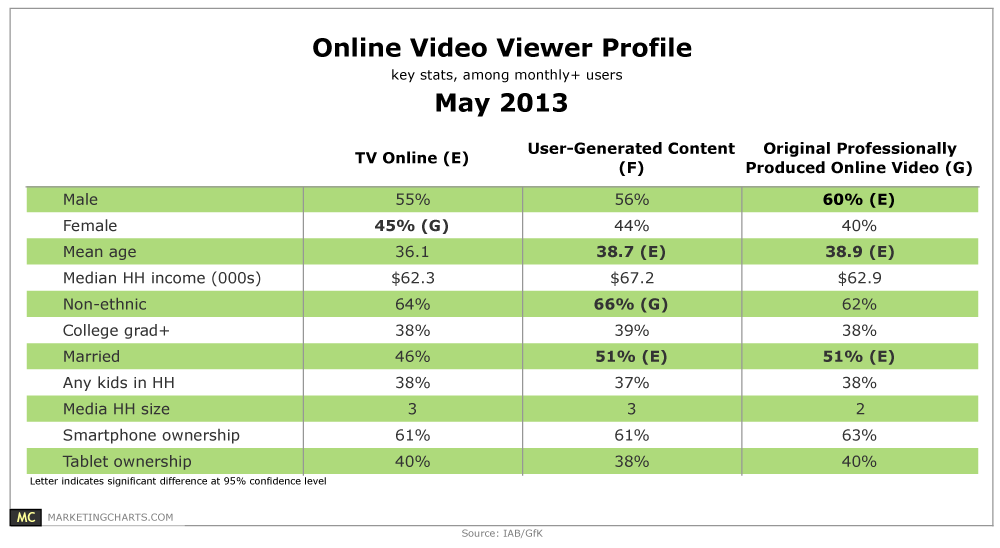
1 in 5 or more American adults watch a TV show online (23%), user-generated content (UGC – 31%), or originally produced online video (OPOV – 19%) on at least a monthly basis.
Read MoreMost Popular Gaming Devices Of Tablet Owners, May 2013 [CHART]
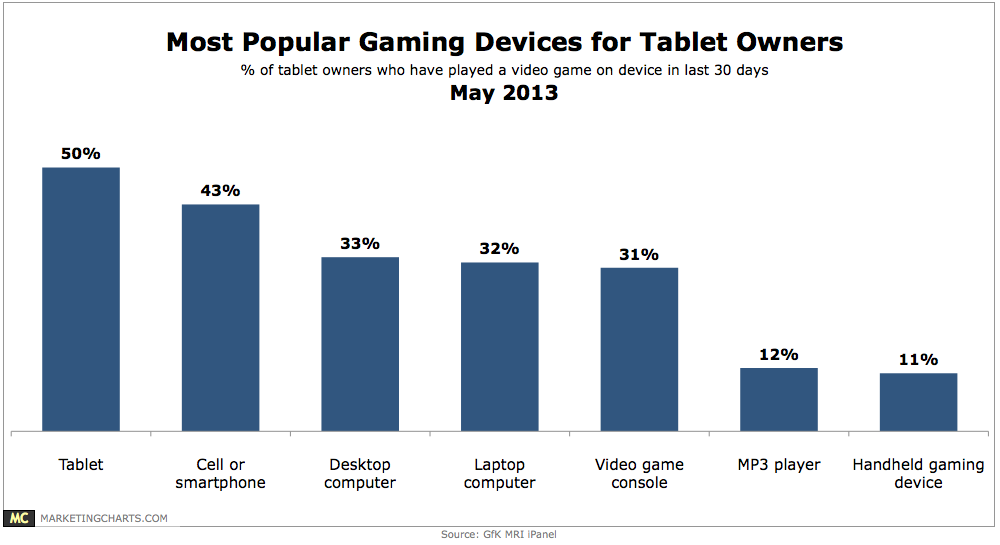
50% of tablet owners played a video game on their device in the past 30 days.
Read MoreSocial Tools New Vehicle Buyers Use For Research, September 2012 [TABLE]
Fully 61% of new vehicle buyers in so-called mature markets, including the US, said they had used some form of social channel.
Read MoreAmerican New Vehicle Buyer Behavior On Auto-Makers' Websites, August 2012 [TABLE]
Multiple-brand consumers were twice as likely to read consumer reviews on those sites.
Read MoreIndustries & Products For Which People Have Written Post-Purchase Online Reviews, October 2012 [TABLE]
Among social network users who took a post-purchase action online, 22% reported posting a review or other comment after an automobile purchase.
Read MoreWhy People Stream Online Video By Content Type, May 2013 [TABLE]
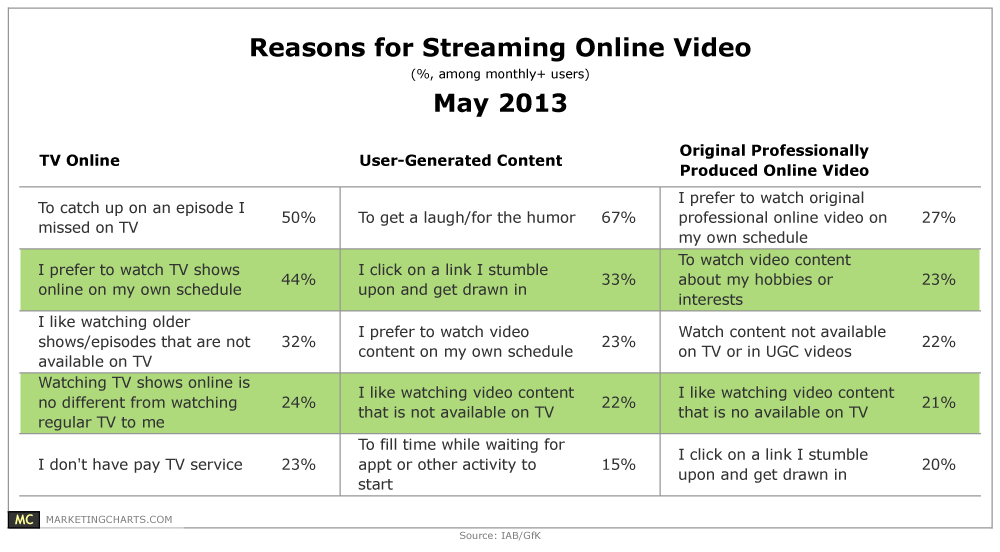
Among monthly users, network TV shows online have the same “wantedness” score as sports on regular TV, and also rivals regular primetime TV, meaning that these viewers attach a similar importance to online and regular TV content.
Read MoreFacebook Brand Response Rates, Q2 2012-Q1 2013 [CHART]
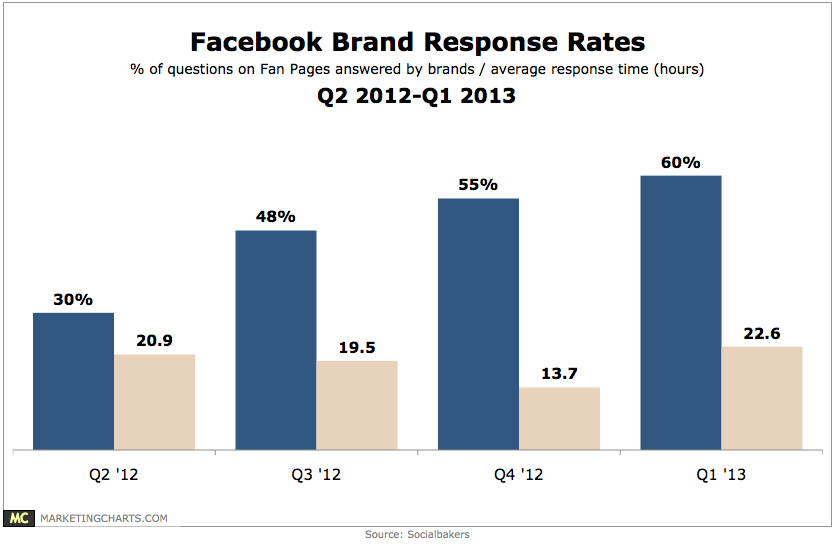
Brands responded to 60% of questions posed to them on Facebook during Q1, up from 55% the previous quarter, and almost double the 30% from Q2 2012.
Read More