Online Behavior
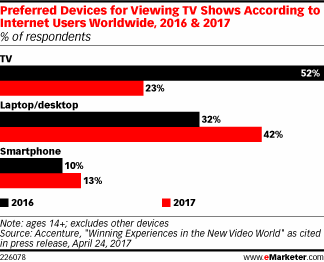
Devices Through Which People Watch TV [CHART]
An Accenture survey of internet users around the world found a dramatic shift in TV viewing preferences, with computers abruptly displacing TVs as the preferred device for watching TV shows.
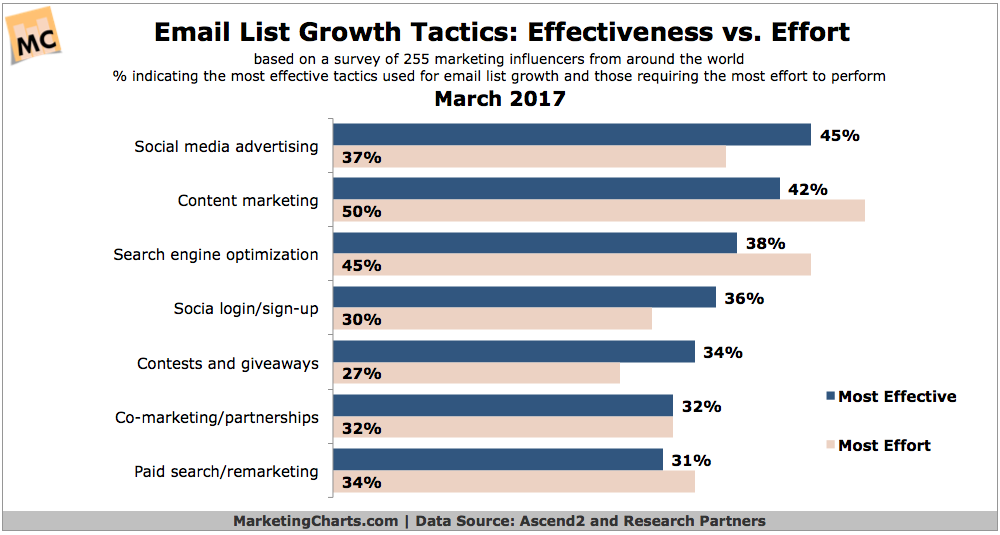
Read MoreEffective Email List Growth Tactics [CHART]
Topping the list of email list growth tactics is social media advertising, cited by almost half of respondents as being among their most effective tactics.
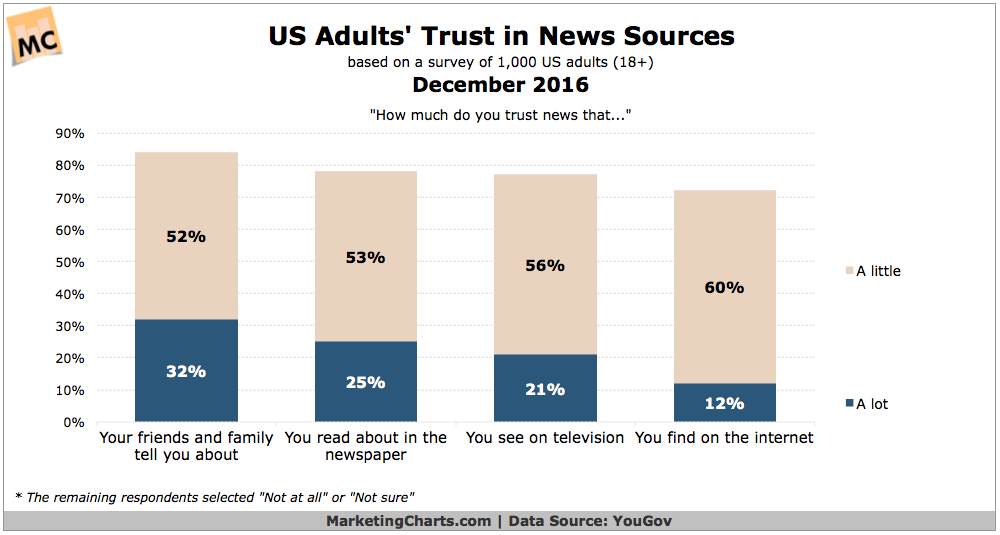
Read MoreConsumer Trust In News Sources [CHART]
Americans are more likely to trust news that they read about in the ewspaper or see on TV than they are to trust what they read online.
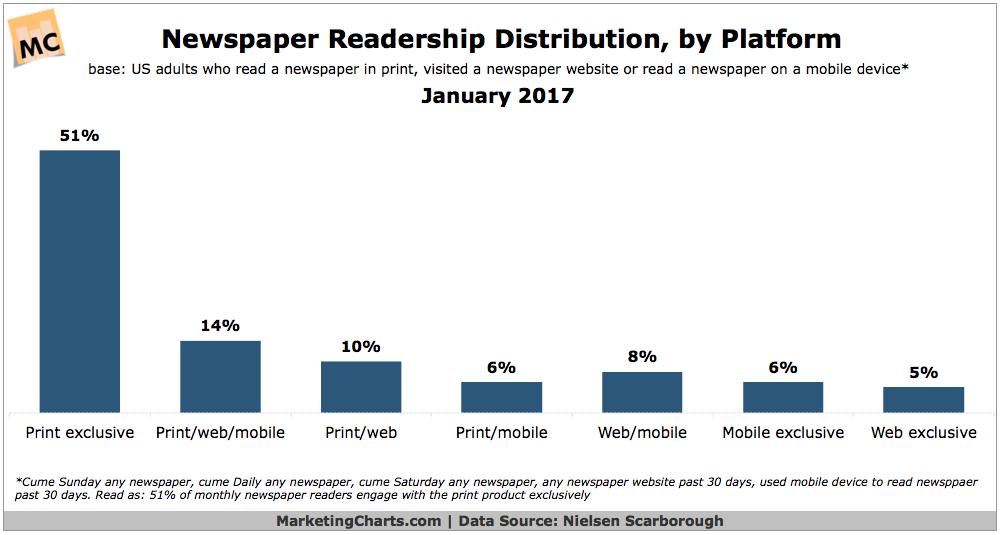
Read MoreNewspaper Readership By Platform [CHART]
Newspapers’ cross-platform audience – print, website and mobile app – numbers more than 169 million adults in the US, or 69% of the US adult population in a typical month.
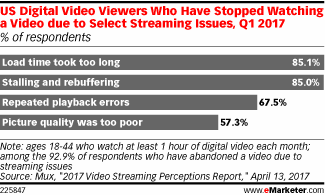
Read MoreWhy People Quit Watching Streaming Videos [CHART]
Video streaming quality issues continue to be a big problem for the advertising and media industries.
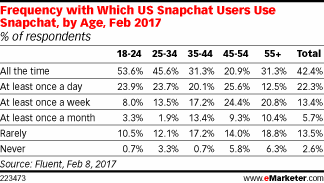
Read MoreFrequency Of Snapchat Use By Age [TABLE]
Some 78% of high school and college student respondents said they use Snapchat on a daily basis.
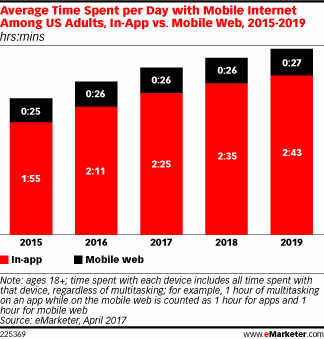
Read MoreAverage Time Spent Per Day On Mobile Internet, 2015-2019 [CHART]
Americans are spending more time within mobile apps and less time within mobile browsers.
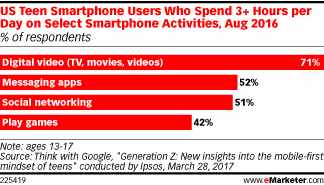
Read MoreTeen Mobile Activities [CHART]
Roughly seven in 10 US teen smartphone users spend at least three hours per day watching video on their phones.
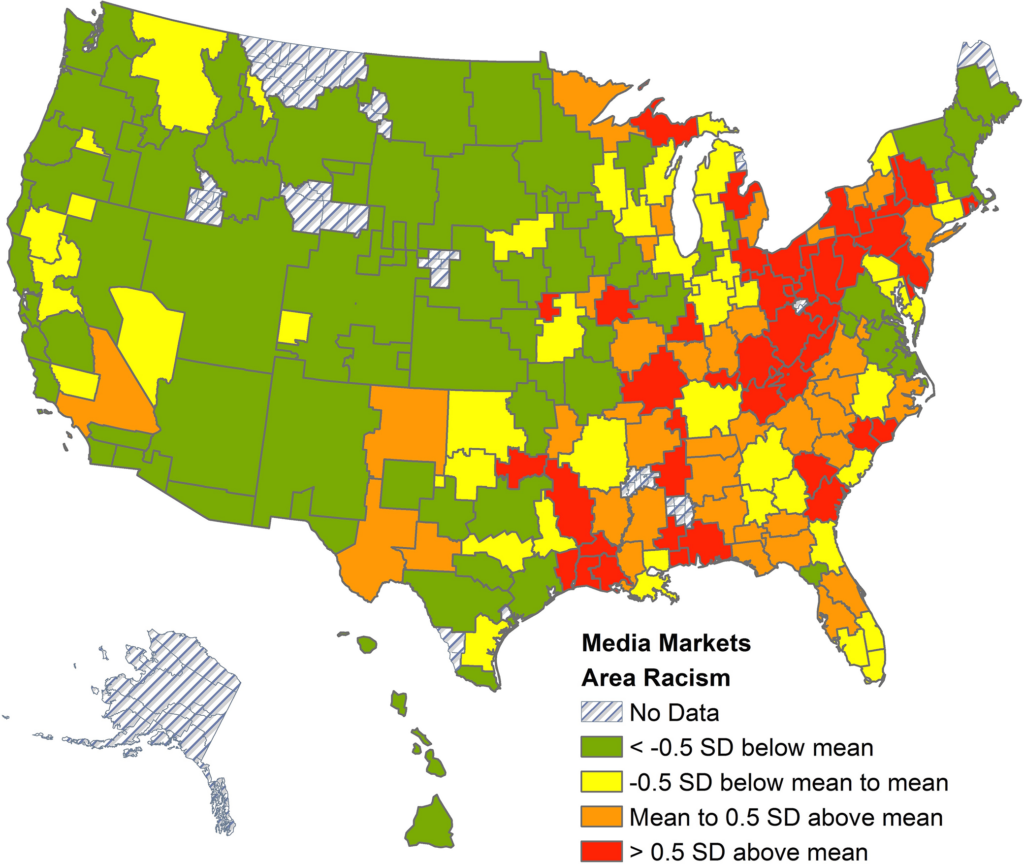
Read MoreRacist Searches By State [MAP]
Where do America’s most racist people live? ‘The rural Northeast and South,’ suggests a new study just published in PLOS ONE.
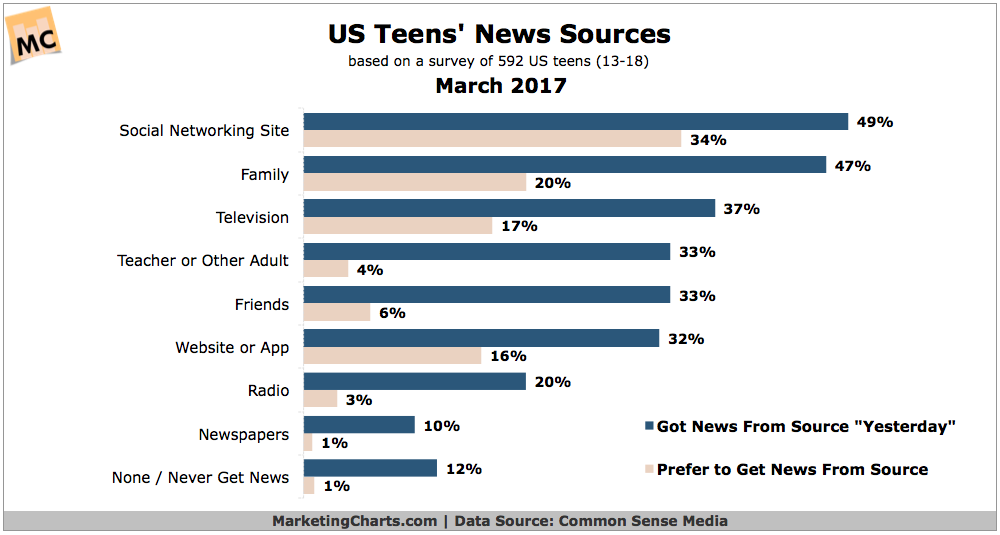
Read MoreTeens' News Media Sources [CHART]
More US teens say they get their news from social networking sites (49%) and family (47%) than from any other source.
Read More