Online Behavior
How Top Customer Experience Marketers Differ, May 2013 [CHART]
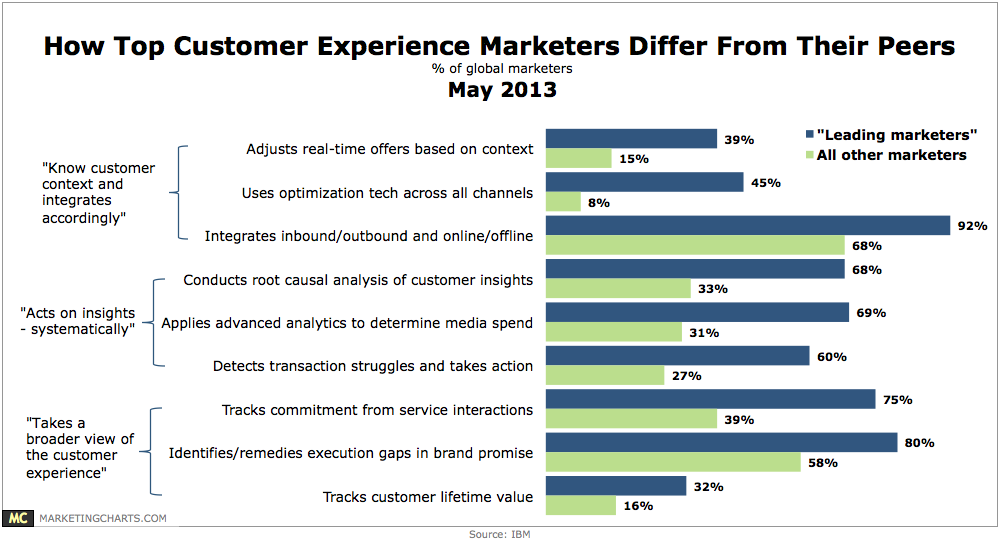
Acquiring new customers (42%), retaining existing customers and improving loyalty and satisfaction (36%), and creating consistent, relevant and positive customer experiences across channels (34%) are among the top challenges being faced by marketers today.
Read MoreMobile & Tablet Video Ad Views By OS, Q1 2013 [CHART]
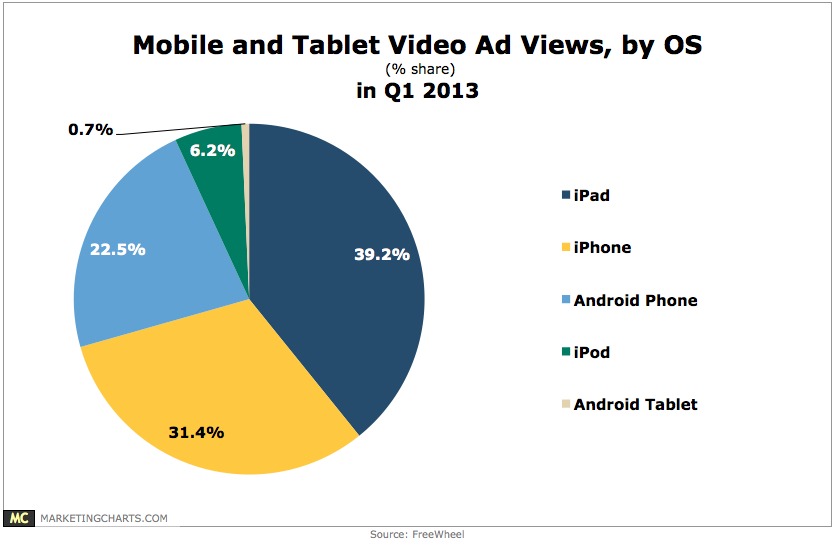
More mobile video ad views took place on an iPhone (31.4% share of mobile and tablet ad views) than an Android phone (22.5% share) in Q1.
Read MoreOnline Streaming Habits, May 2013 [TABLE]
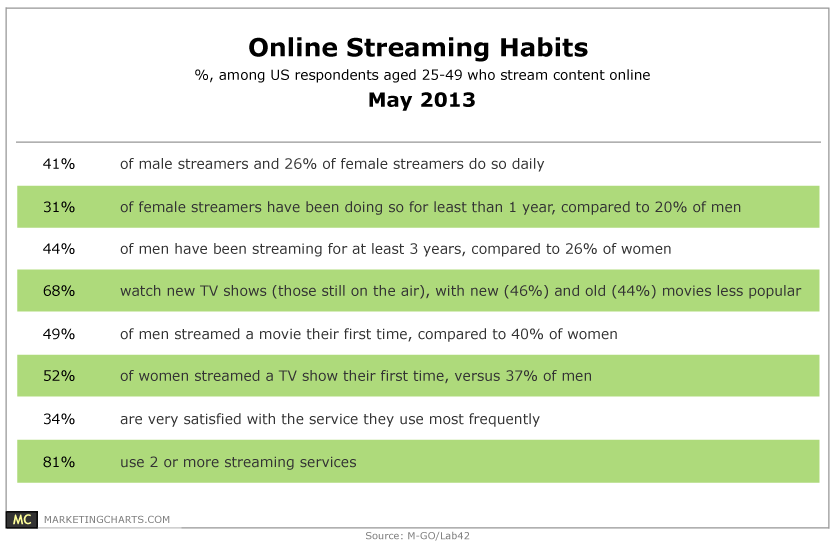
A survey from M-GO of streaming media consumers finds that new TV shows are their most popular type of programming, cited by 68% of respondents, with new movies (46%) and older movies (44%) in tow.
Read MoreOnline Video Views By Duration, Q1 2013 [CHART]
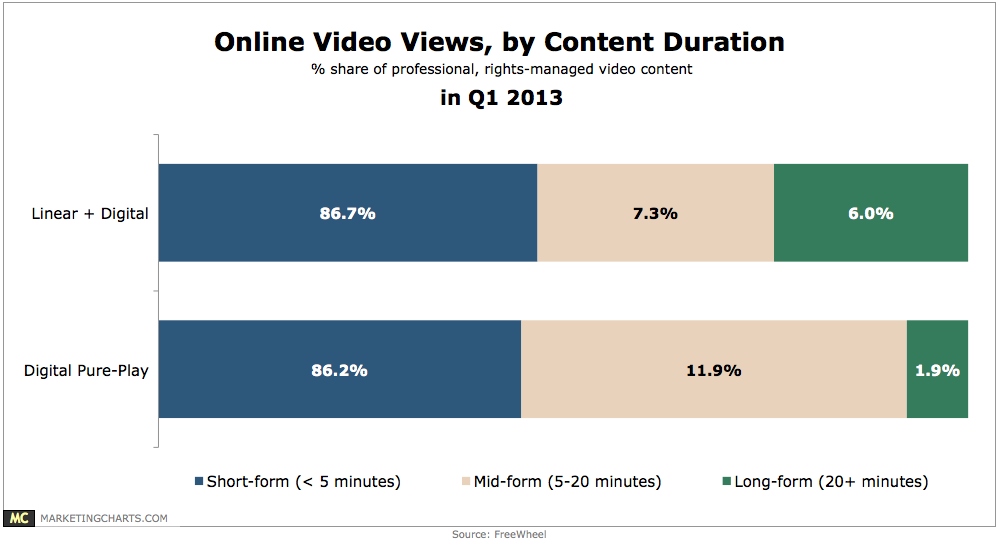
86.7% of video views on “Linear + Digital” networks were less than 5 minutes in length, as were 86.2% of video views on “Digital Pure-Play” networks.
Read MoreMoms' Social Sharing By Content Type, May 2013 [CHART]
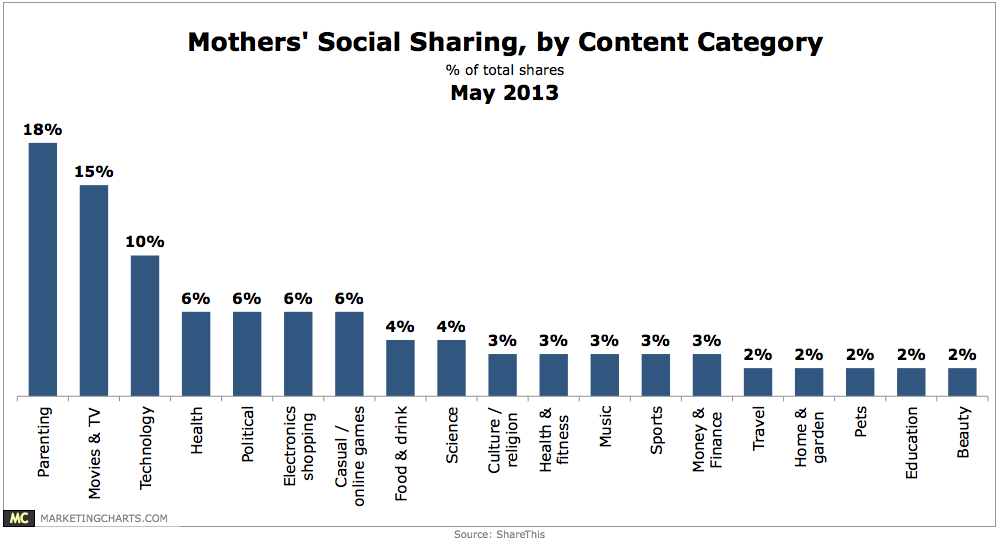
30% of mothers shared content on the ShareThis network during the period, compared to 10% of the network’s overall average.
Read MoreShare of eCommerce Traffic From Smart Devices, Q1 2012 – Q1 2013 [CHART]
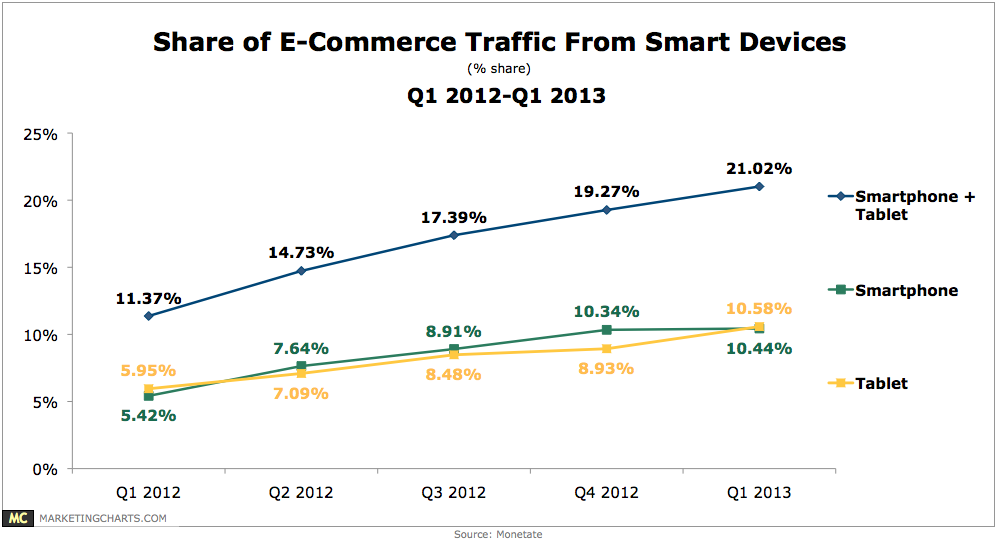
Tablets accounted for 10.6% of e-commerce site traffic in Q1, up from 8.9% a quarter earlier, while smartphones also exceeded 10% of traffic (10.44%), though with only slight growth from the previous quarter.
Read MoreMobile Video Discovery Methods, May 2013 [CHART]
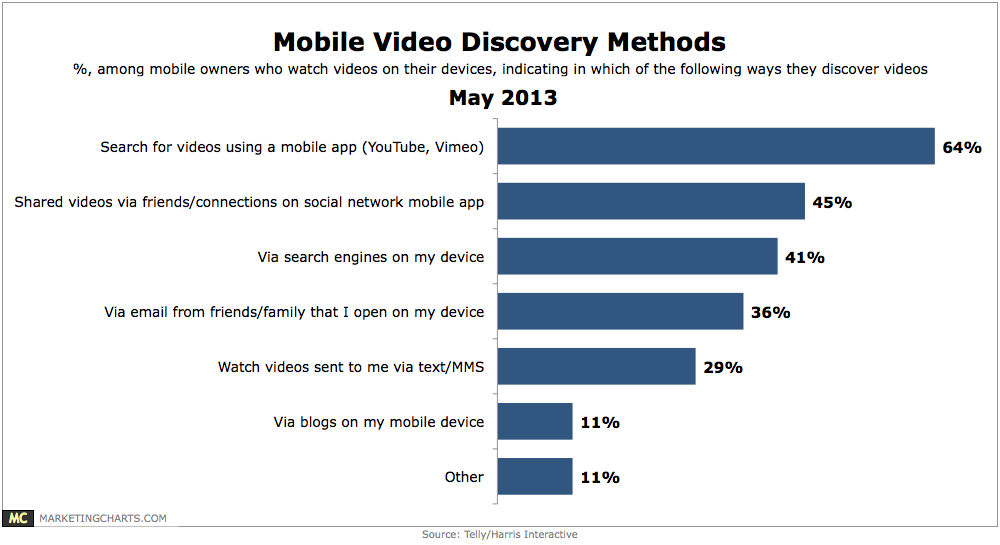
35% of mobile device owners watch videos on their device.
Read MoreCross-Device Travel Research & Purchase Behavior, May 2013 [CHART]
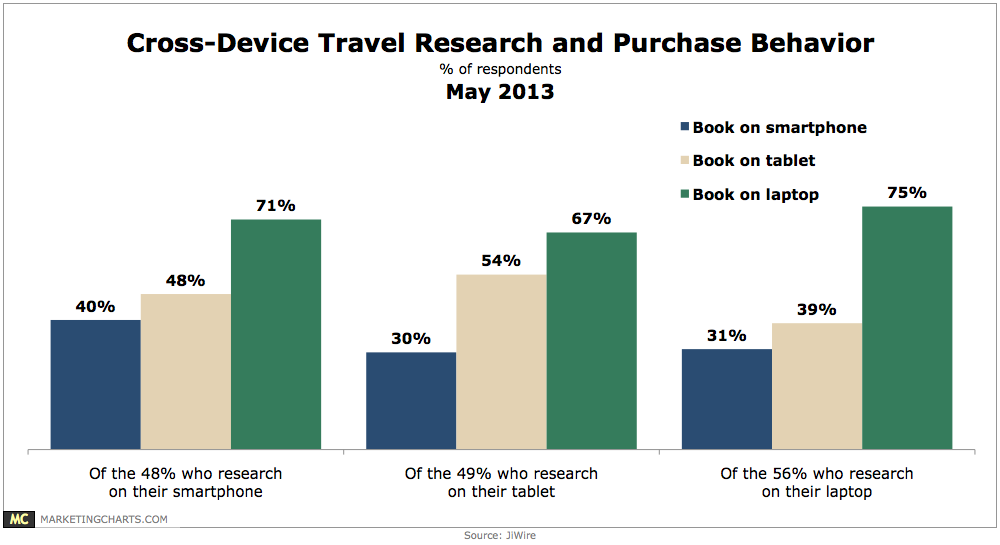
Among mobile owners who booked travel in the past 90 days, only 53% used a single device (smart phone, tablet, or laptop) to do so.
Read MoreUS Mobile Phone Gamers, 2011-2017 [TABLE]
Double-digit mobile gaming growth rates will continue into 2015, when half of all US residents are expected to play games via their mobile phone at least once per month.
Read MoreUS Mobile Gaming Revenue Share By Type, 2011-2017 [CHART]
This year, the largest share of revenues will come from downloads of games themselves, with in-game purchases accounting for just slightly less.
Read More