Online Behavior
Mothers’ Mobile Use By Weekday, June 2013 [CHART]
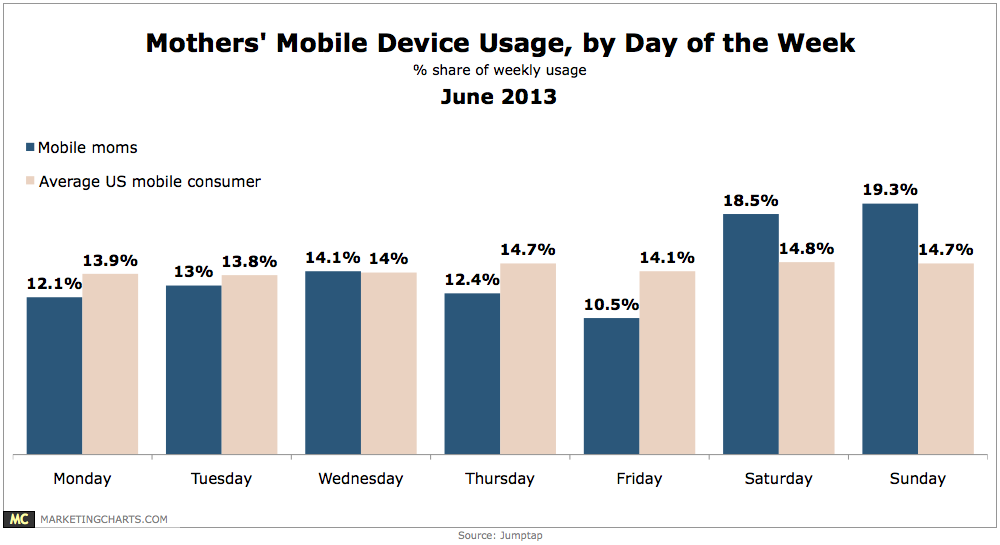
Almost 40% of mothers’ weekly time spent with their mobiles is on Saturday (18.5%) and Sunday (19.3%).
Read MoreB2B Procurers' Online Shopping By Age, June 2013 [CHART]
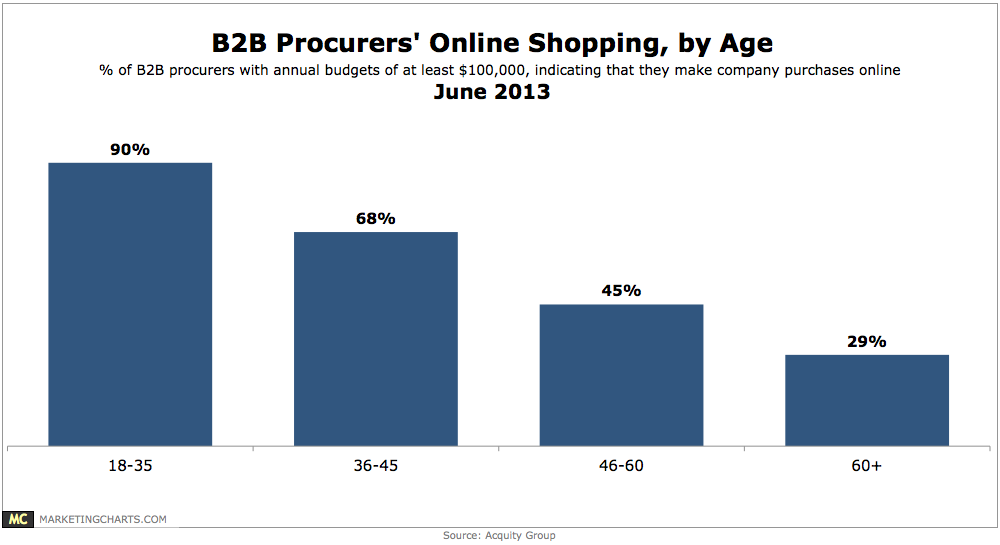
Millennial B2B buyers are far more likely than their older counterparts to make online purchases.
Read MoreSubscription On-Demand Video Market Share, Q1 2012 vs Q1 2013 [CHART]
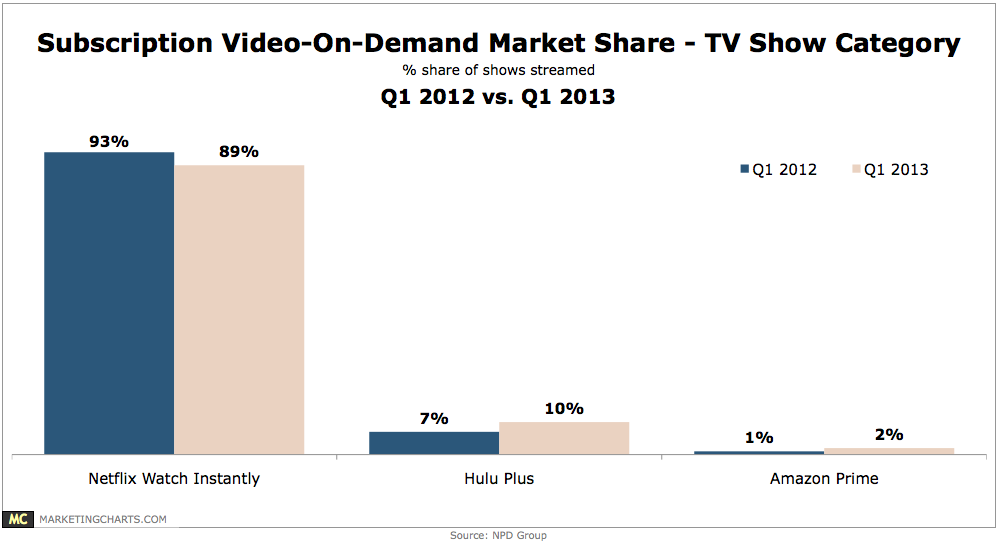
Netflix accounts for almost one-third of North American peak downstream internet traffic.
Read More#ThoughtsAndPrayers
Is there an appropriate way to acknowledge national tragedies on social media or should brands simply remain silent?
Read MoreProducts Researched & Purchased On A Tablet, March 2012 [TABLE]
A survey from the Online Publishers Association compared product research with product purchase by category among tablet users in March 2013.
Read MoreUS Mobile Shoppers Who Use Tablets, 2011-2017 [TABLE]
In 2011, there were 23.2 million US mobile shoppers using tablets.
Read MoreTablet Ad Categories To Which Users Are Most Likely To Respond By Gender, January 2013 [CHART]
The content that beauty consumers devour in magazines are ripe for the interactive opportunities that tablets can provide.
Read MoreTelevision Viewing Places By Device, June 2013 [TABLE]
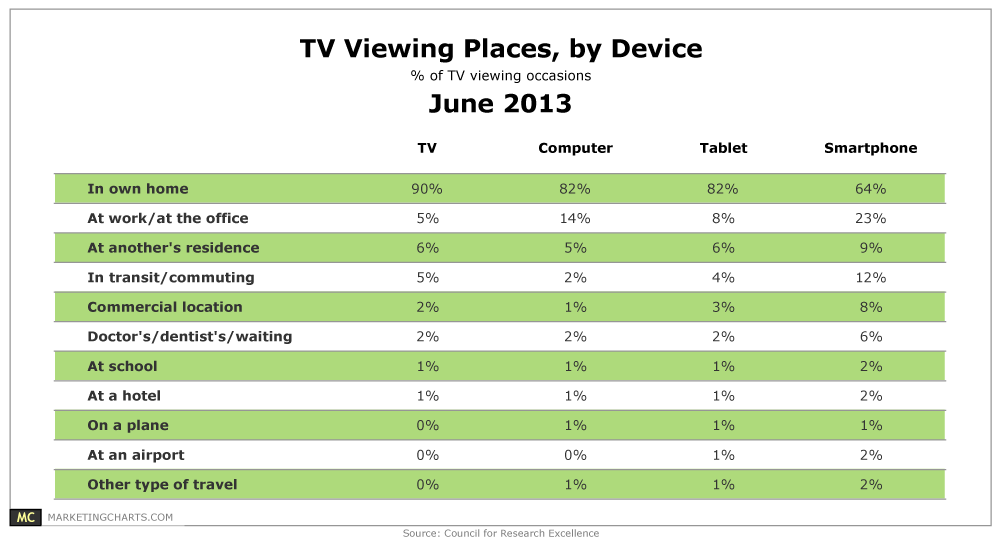
64% of smart phone TV viewing occasions occurred at home.
Read MorePreferred Television Genres By Viewing Device, June 2013 [CHART]
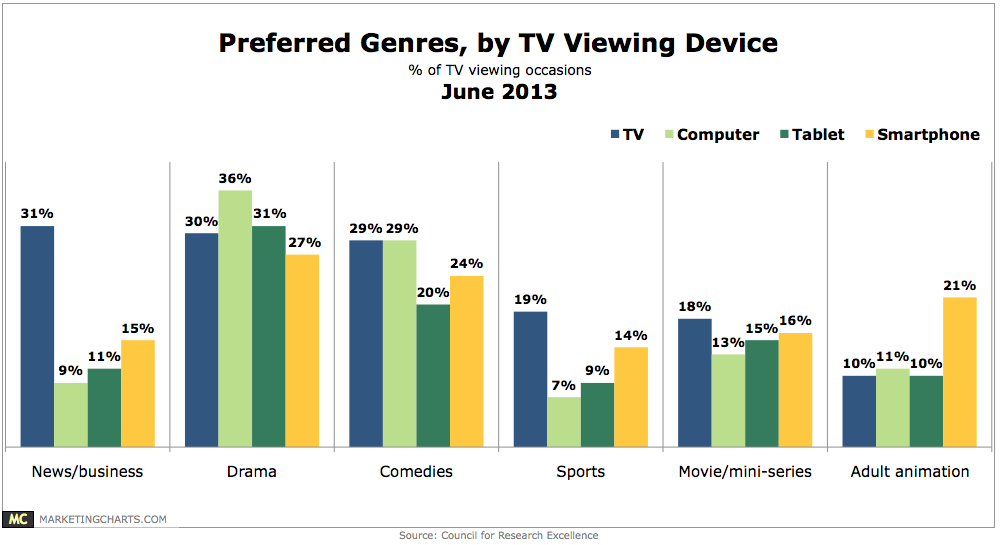
On the traditional TV, news and business (31%) got the edge on drama (30%) and comedies (29%) as the top genres by percentage of viewing occasions.
Read MoreTV Viewing Times By Device, June 2013 [TABLE]
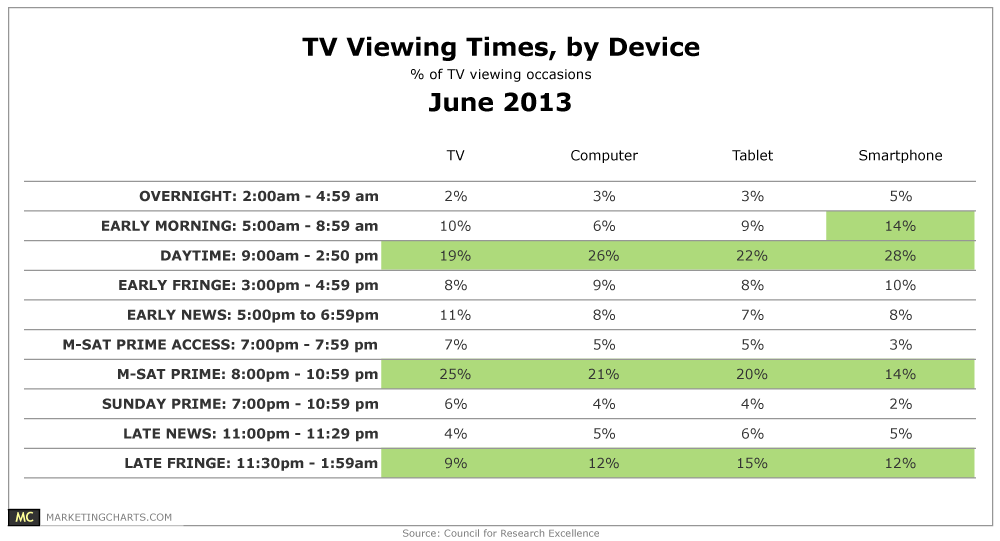
A plurality of tablet (22%) and smart phone (28%) TV viewing occasions tracked occurred during the daytime, between 9 AM and 3 PM.
Read More