Online Behavior
Tablet vs. Smart Phone Website Visits For Select Industries, January 2013 [CHART]
Travel not only had the highest percentage of internet traffic coming from tablets at 11.2%, but it was also the only industry studied that actually saw more tablet traffic than smart phone traffic.
Read MoreAverage Global Hotel Website Pageviews/Visit by Device, Q4 2012 [CHART]
Tablet users spent much more time on hotel websites, viewing an average of 4.9 pages per visit in Q4 2012, approximately the same as PC users.
Read MoreGlobal Hotel Website Visits By Device, Q4 2012 [CHART]
Google predicted that US hotel searches would be up 24% in 2013 overall, but that includes a 68% uptick in searches from mobile devices against a 4% decrease in desktop queries.
Read MoreHow People Find Websites, 2011 vs. 2012 [CHART]
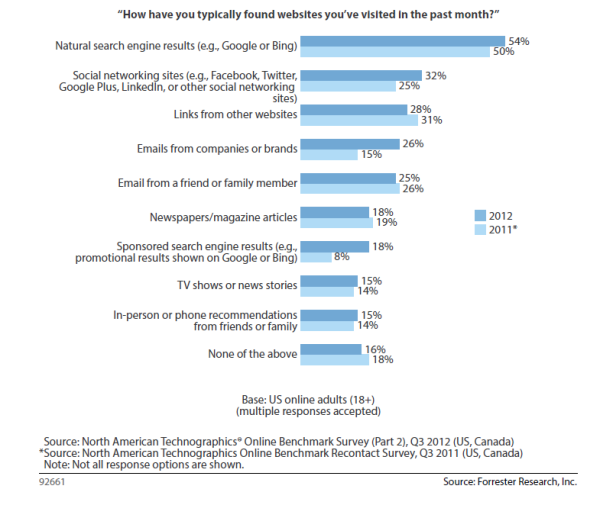
54% of respondents found websites through natural search results in 2012, up from 50% in 2011.
Read MoreFacebook Ad Performance By Industry, Q1 2013 [CHART]
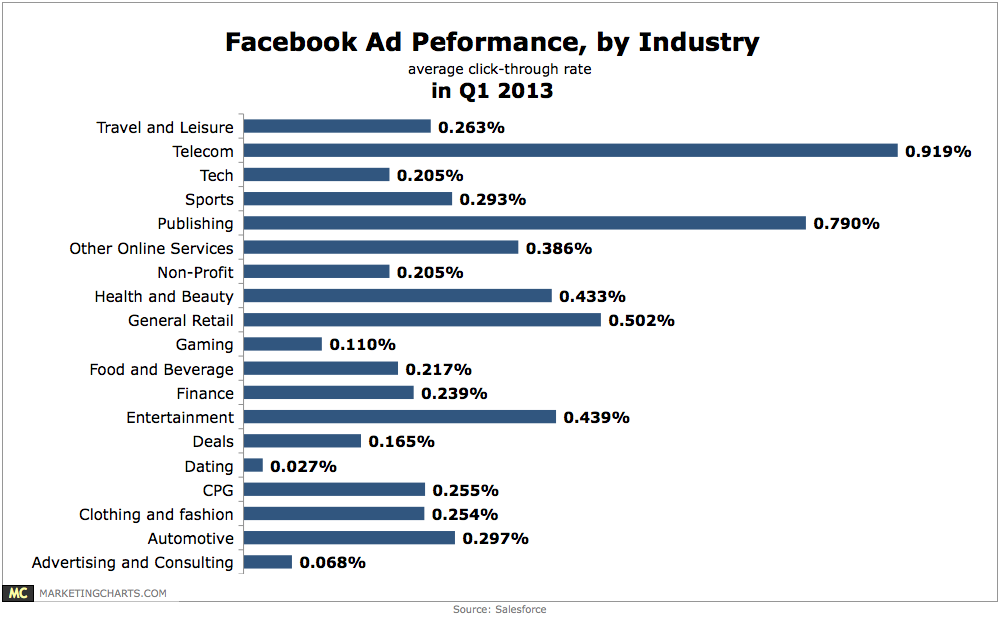
Telecom (0.919%) and publishing (0.79%) brands are leading the charge in click-through rates.
Read MoreDemographics Of Social Media Users By Network, October 2012 [TABLE]
Mobile will be the dominant platform to reach US millennials for the foreseeable future.
Read MoreDemographics Of Auto Website Visitors, June 2012 [CHART]
The 18-to-34-year-old segment still makes up a large portion of digital automotive media consumption.
Read MoreSMB Top Online Marketing Objectives, June 2013 [CHART]
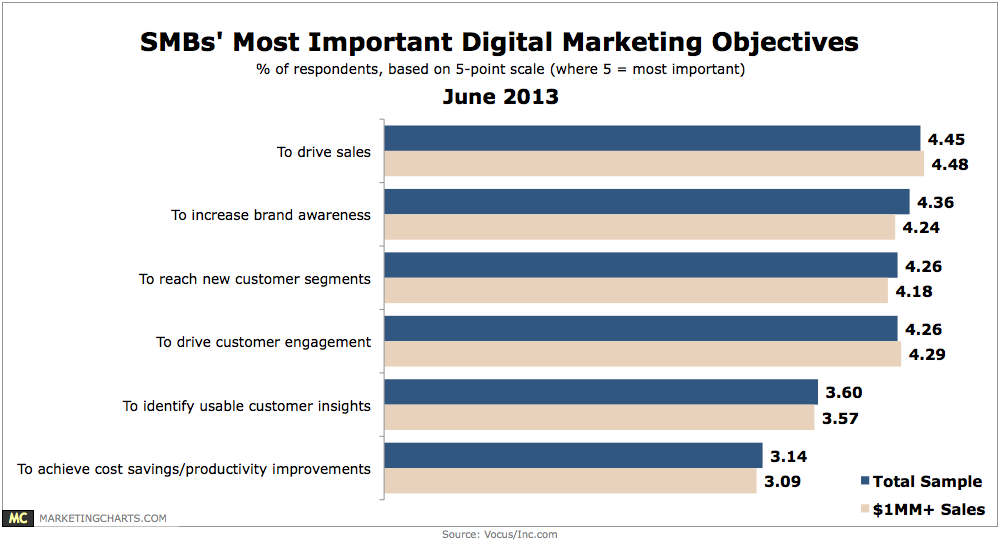
About half of SMBs engaged in digital marketing devote at least 50% of their marketing budgets to digital.
Read MoreVine Growth, December 2012 – May 2013 [CHART]
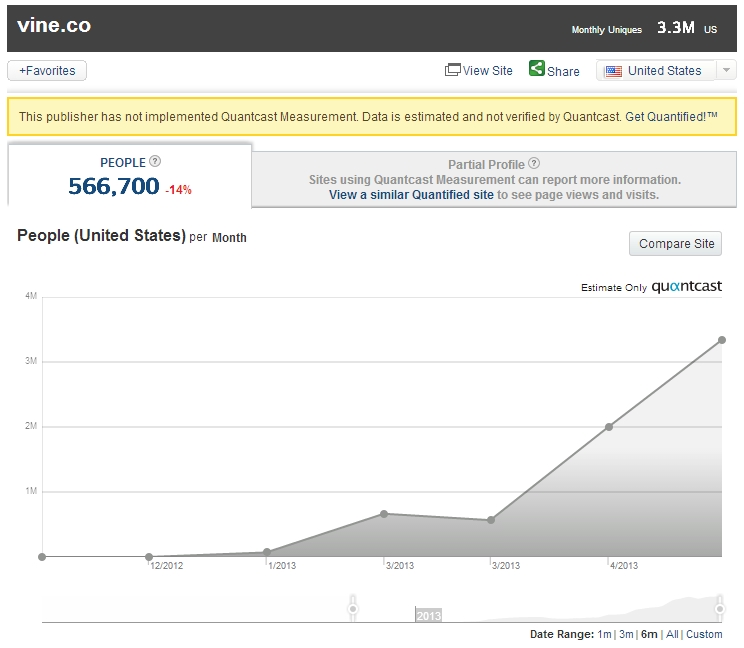
From just 77,000 unique visitors in January, Vine’s website vine.co grew to 3.6 million unique desktop visitors in May.
Read MoreConversion Rates Of Duplicate Leads, June 2013 [CHART]
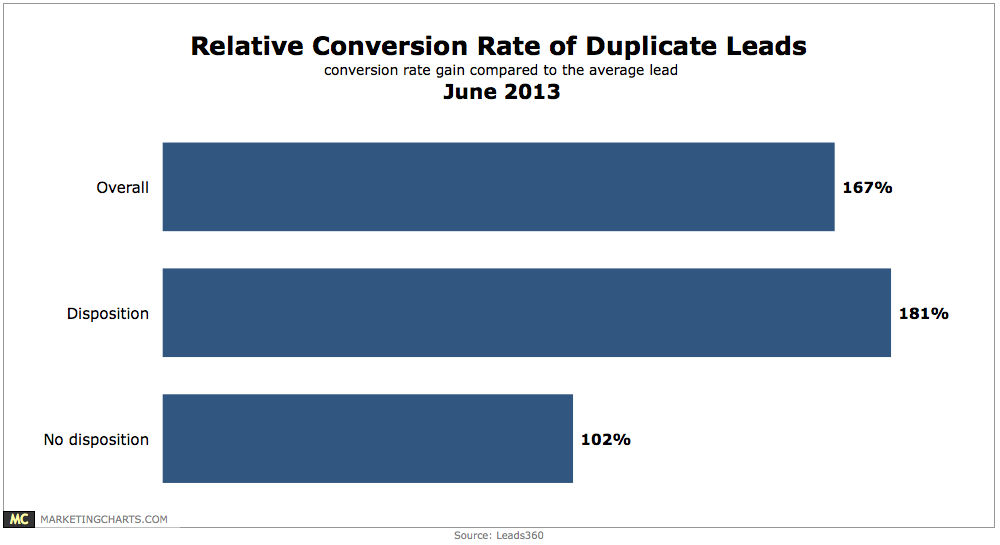
Leads360 found that those leads flagged as duplicates converted at a rate 167% higher than the average.
Read More