Online Behavior
Consumer Attitudes Toward Online Personal Data Collection, June 2013 [CHART]
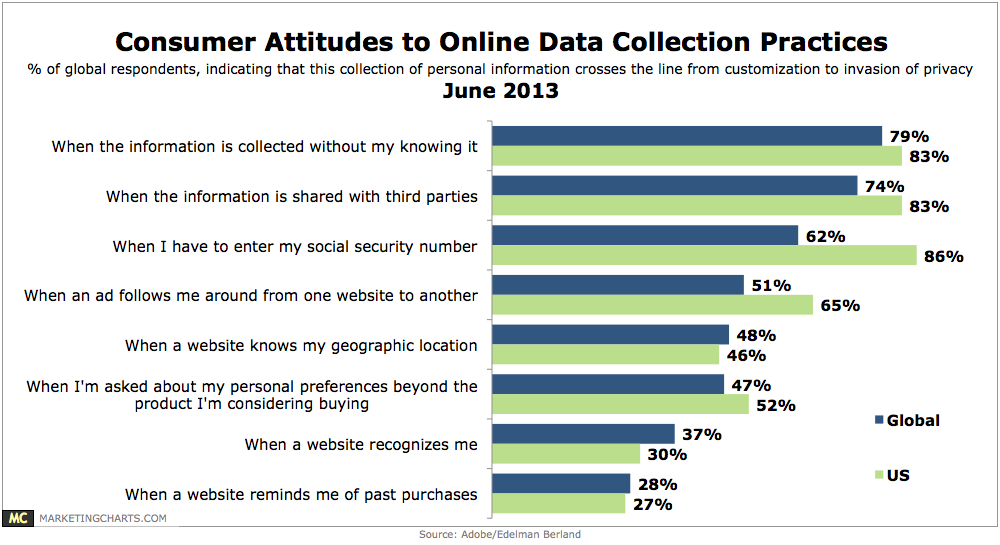
Consumers around the world find website customization to be of some value, with 33% of respondents attributing some value to personalized product and service recommendations on websites, compared to 26% seeing little to no value.
Read MoreSkills Needed To Be A Successful Marketer, June 2013 [CHART]
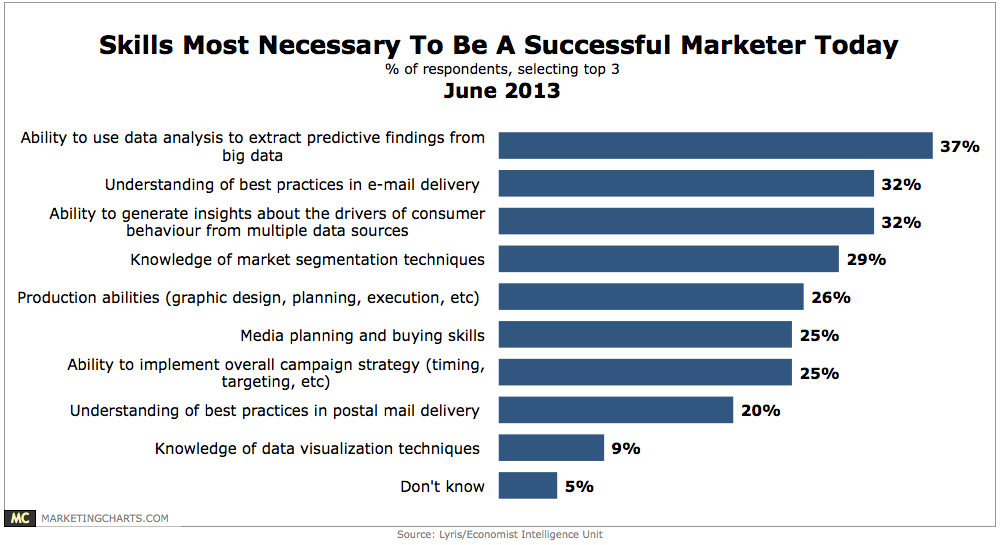
Respondents indicated that the most necessary skill today is the ability to use data analysis to extract predictive findings from big data.
Read MoreOnline Ad Viewability, June 2013 [TABLE]
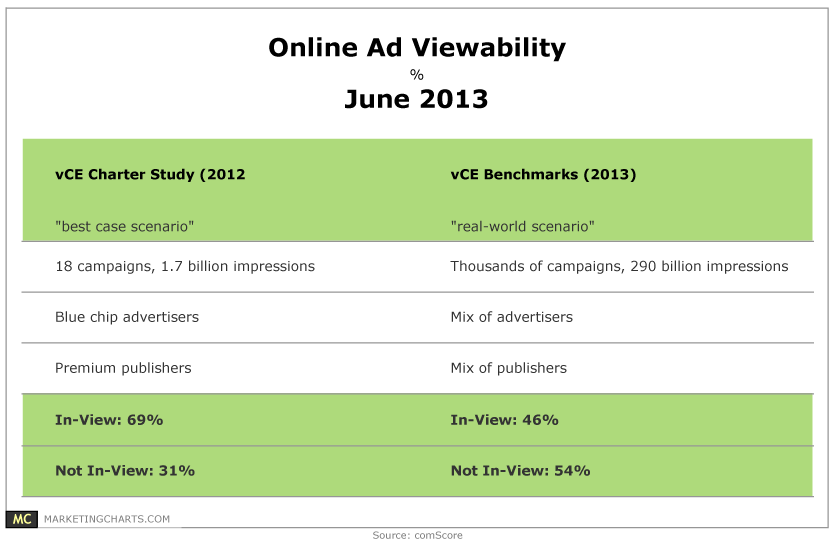
comScore says that 54% of ads are not in-view.
Read MoreMobile Media Consumption By Gender, March 2013 [CHART]
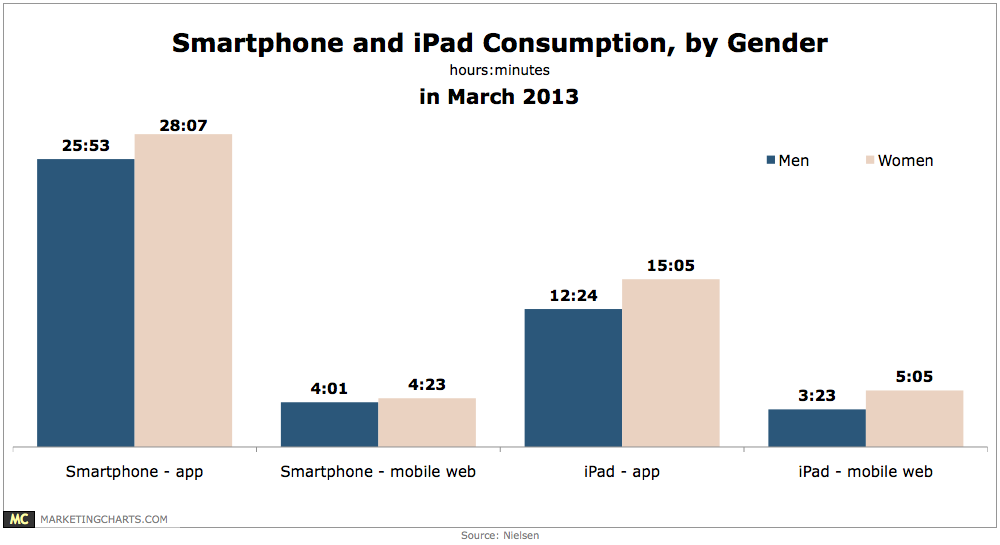
Smart phone users spent just 13% of their time using the mobile web, and iPad users a relatively larger – but still minor – 24%.
Read MoreTV Everywhere & Subscription Television Satisfaction, June 2013 [CHART]
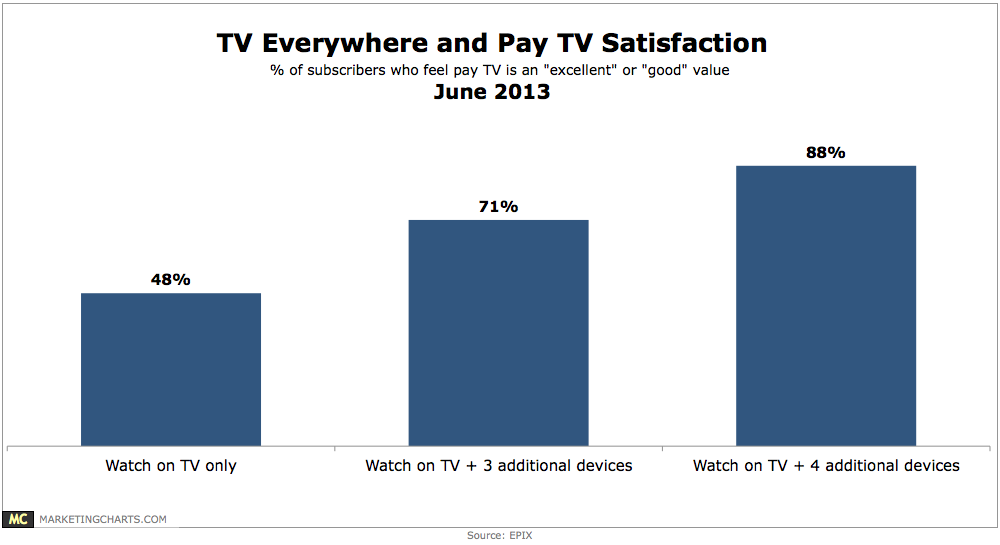
TV Everywhere has yet to reach 50% of America’s multichannel TV subscribers.
Read MoreAmerican Video Gamers By Type, 2013 [CHART]
Just fewer than seven out of 10 US residents had ever played video or computer games.
Read MoreGlobal Social Network User Penetration By Region, 2011-2017 [TABLE]
Through 2015, the more advanced social network markets of North America, Western Europe and Central and Eastern Europe will have the highest penetration rates worldwide.
Read MoreSocial Network Users By Region & Country, 2011-2017 [TABLE]
Though Asia-Pacific will have the largest social network population worldwide through 2017 and the Middle East and Africa will have the second-largest audience starting next year, their population penetration rates are among the lowest.
Read MoreGlobal Social Network Users, 2011-2017 [CHART]
The number of social network users around the world will rise from 1.47 billion in 2012 to 1.73 billion this year, an 18% increase. By 2017, the global social network audience will total 2.55 billion.
Read MoreBest Sources For Marketing & Advertising, June 2013 [CHART]
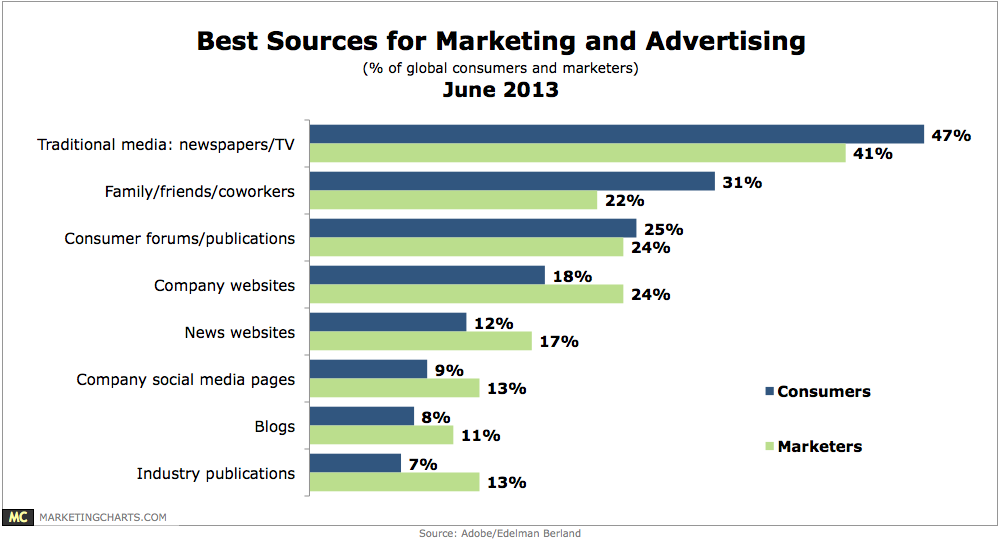
Consumers were more likely than marketers to choose traditional media sources such as newspapers and TV as best for advertising (47% vs. 41%), and also more likely to see their family, friends and co-workers as influential (31% vs. 22%).
Read More