Online Behavior
Email Innovation [CHART]
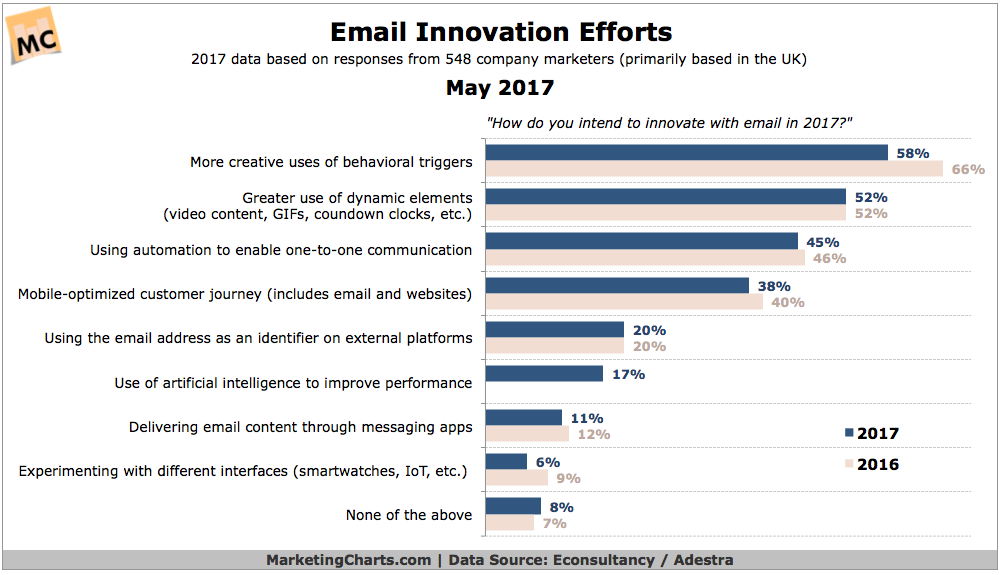
Personalization has jumped to the top as the leading area of focus for company respondents this year, overtaking automation.
Read MoreVirtual Reality Users, 2016-2019 [CHART]
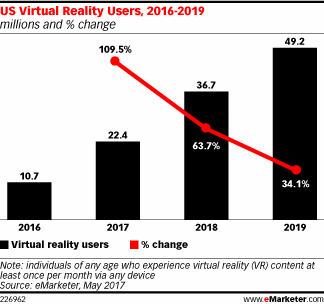
Virtual Reality has been slower to catch on in the US than Augmented Reality, and will not reach mass adoption in the foreseeable future.
Read MoreAugmented Reality Users, 2016-2019 [CHART]
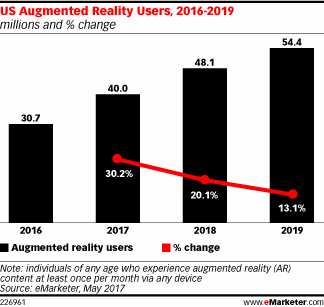
In 2017, 40.0 million people in the US will engage with some form of augmented reality (AR) at least monthly, up 30.2% over last year.
Read MoreWhy People Won't Buy VR Headsets [TABLE]
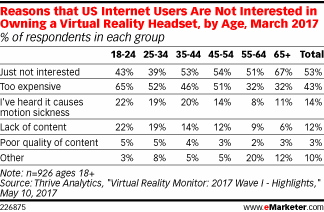
Cost isn’t the only factor holding back adoption of these virtual reality headsets. Many people are simply not interested in them.
Read MoreBudgeting For Digital Marketing Trends [INFOGRAPHIC]
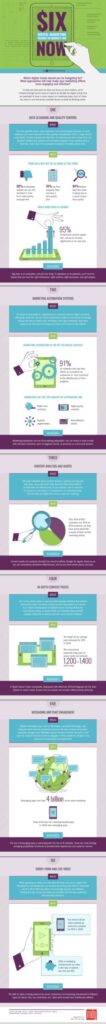
This infographic by MGD Advertising identifies the six trends that are the most important for digital marketers to budget for.
Read MorePopularity vs Effectiveness Of Content Marketing Types [CHART]
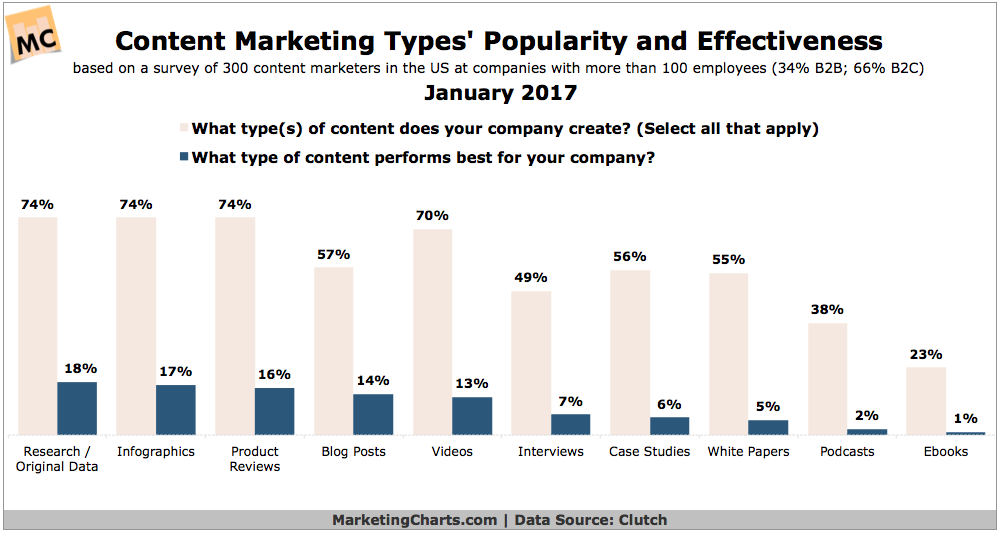
The top content formats produced by content marketers in the US are research/original data, infographics and product reviews.
Read MoreVoice-Activated Digital Assistant Adoption [CHART]
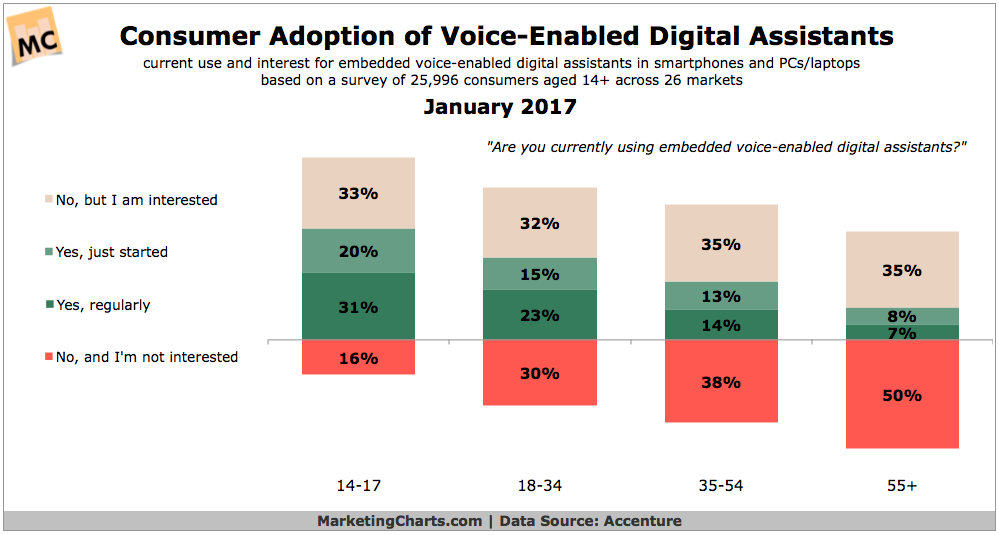
The use of embedded voice-enabled digital assistants in smartphones and PC/laptops has reached the mainstream among 14-17-year-olds.
Read MoreUS Political Ad Spending Allocations, 2012 vs 2016 [CHART]
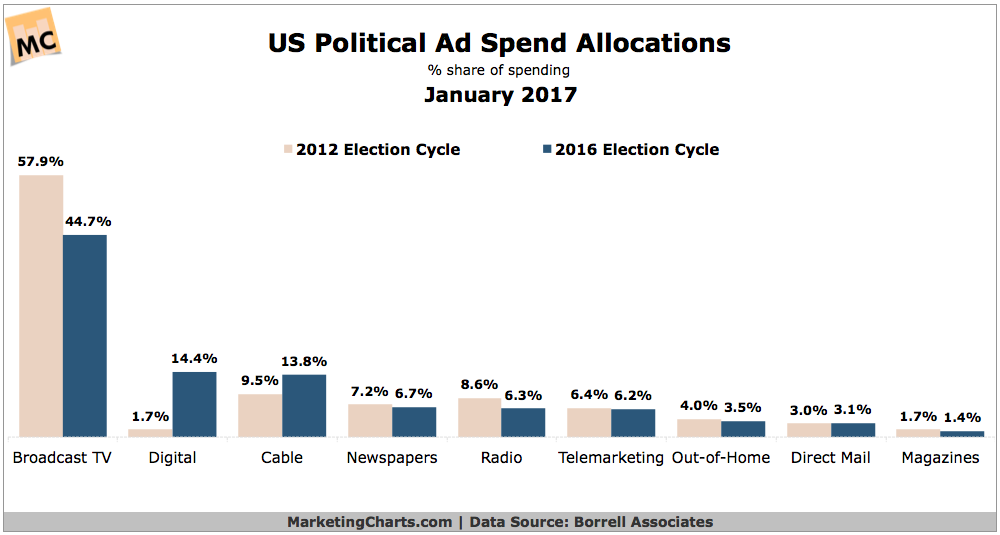
Political advertising reached $9.8 billion in the 2016 election year, marking a more than 4% increase from the 2012 election cycle ($9.4 billion) and representing a new record.
Read MoreTechnographics Of American Mothers [CHART]
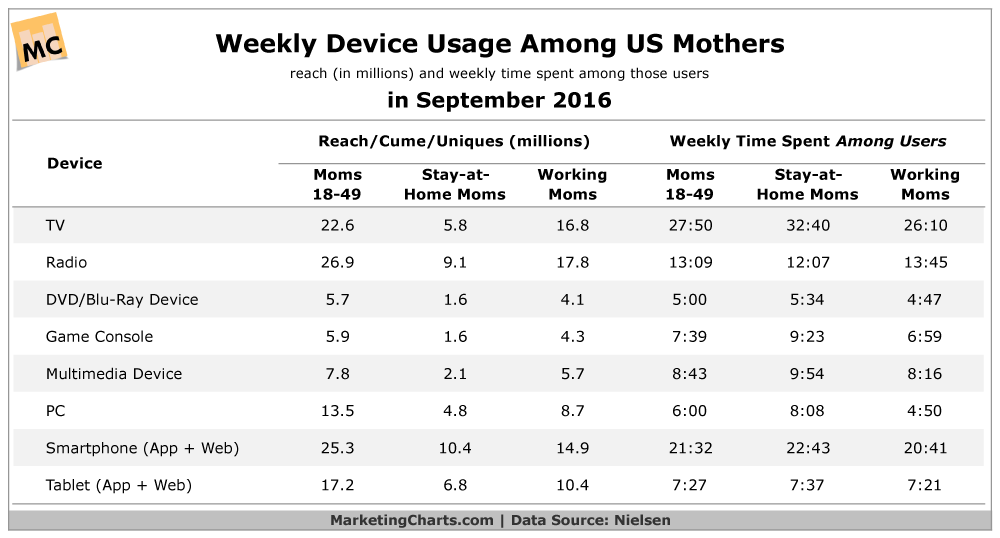
Across 10 technologies, ownership levels are universally greater among working than stay-at-home moms.
Read MoreFuture Of Robotics & Artificial Intelligence [INFOGRAPHIC]
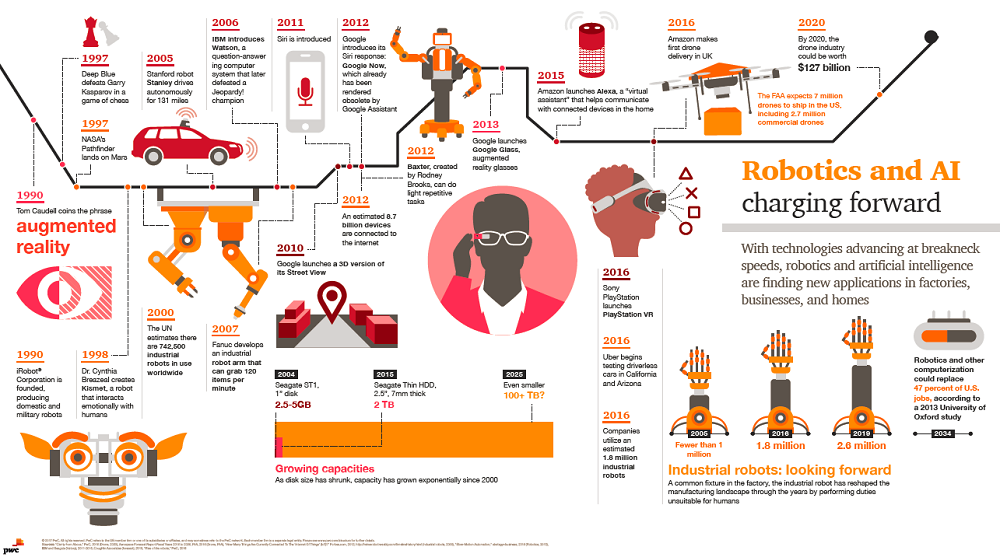
This infographic by PricewaterhouseCoopers illustrates the future of robotics and AI.
Read More