Online Behavior
Subscriber Engagement With Autoresponder Sequences, October 2013 [CHART]
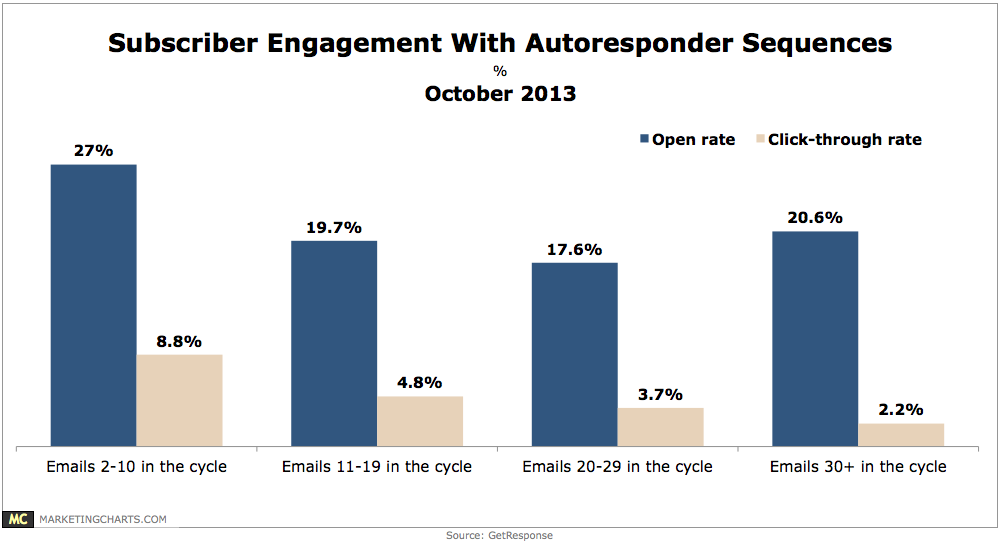
The average autoresponder sequence contains 8 emails and spans 49 days.
Read MoreFS1 vs ESPN [INFOGRAPHIC]
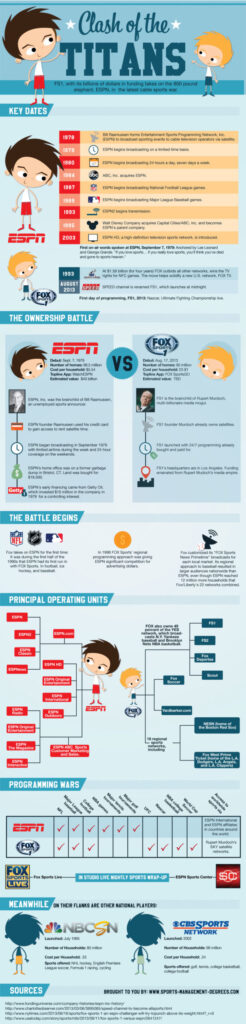
This inforgraphic from Sports Management Degrees illustrates the new battle between FS1 and ESPN for sports television supremacy.
Read MoreEmail Open & Click-Through Rate Trends, Q4 2009 – Q2 2013 [CHART]
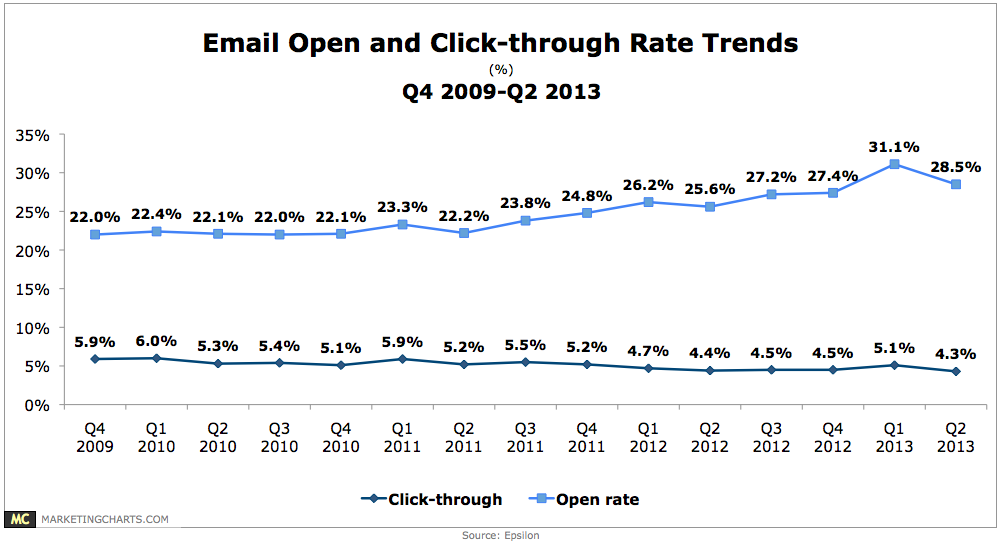
The average business-as-usual (BAU) email open rate in North America fell to 28.8% in Q2 after hitting a multi-quarter peak of 31.1% in Q1.
Read MoreEmail Subscriber Activity, Q2 2013 [CHART]
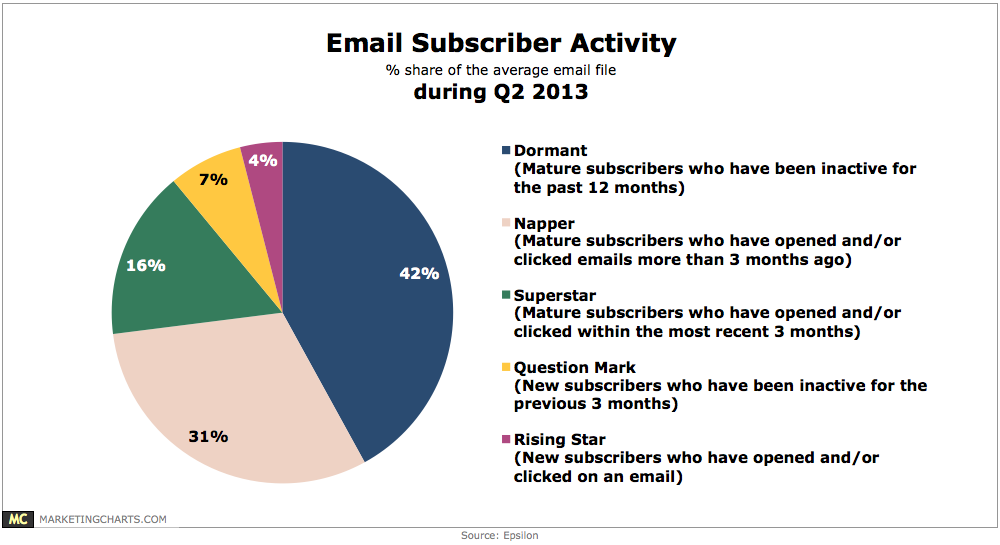
During Q2 2013, 51% of the average email file was active.
Read MoreUS Smart Phone vs Tablet Penetration, 2011-2014 [CHART]
Smart phones became the norm in the past couple of years, and now tablets too are settling into that territory.
Read MoreConsumer Attitudes Toward Shopping Cart Reminder Emails, October 2013 [CHART]
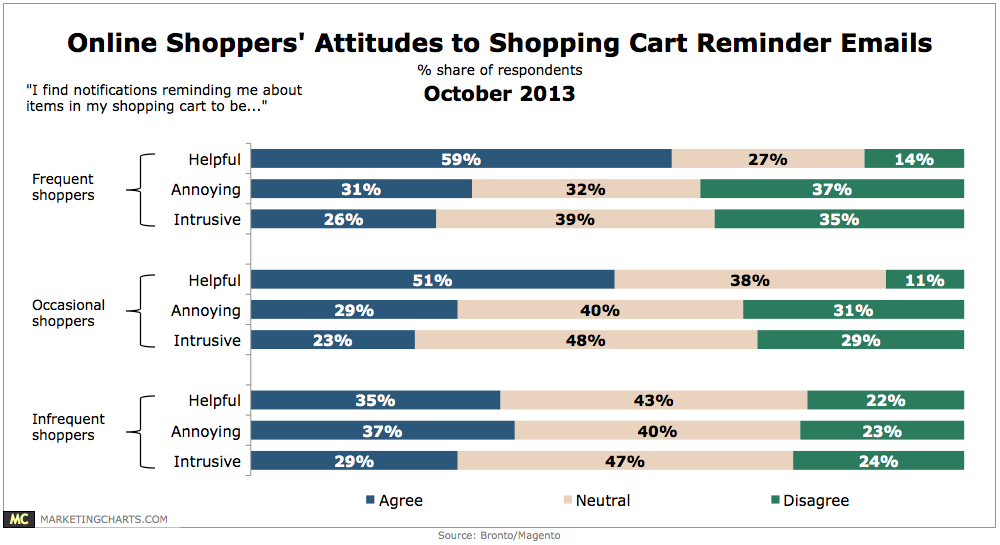
Fully two-thirds of infrequent shoppers (those who shop online less than once a month) did not expect to get any type of reminder email.
Read MoreNetworks B2B Marketers Use To Cross-Post On Twitter, June 1 – August 31, 2013 [CHART]
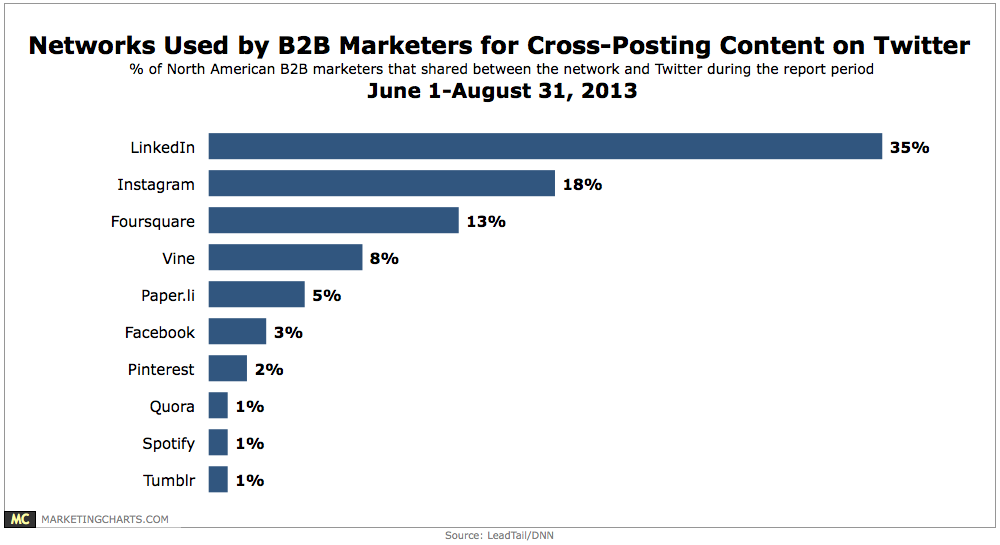
More than one-third of B2B marketers on Twitter shared content from LinkedIn during the study period.
Read MoreWhy People Don't Use Mobile Banking, June 2013 [CHART]
Security concerns topped the list of reasons why smart phone users didn’t use banking services on their devices.
Read MoreFinance/Banking Services US Internet Users Have Signed Up For By Age, June 2013 [TABLE]
Bank websites are the top method for managing personal finances, particularly among those who own smart phones.
Read MoreSocial Media Activities Performed While Watching TV, 2013 [TABLE]
15% to 17% of TV viewers engaged in real-time socializing about the television shows they were watching.
Read More