Online Behavior
Top Social Media Metrics For Enterprise Brands, October 2013 [CHART]
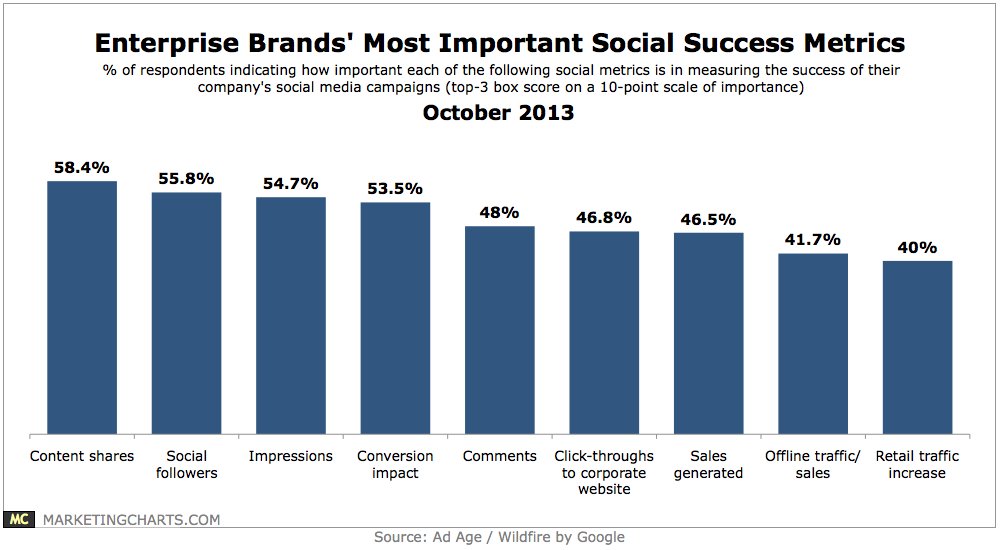
A leading 58% of respondents consider content shares to be an important metric for measuring the success of their social media campaigns.
Read MoreOnline Video Ad Effectiveness, October 2013 [TABLE]
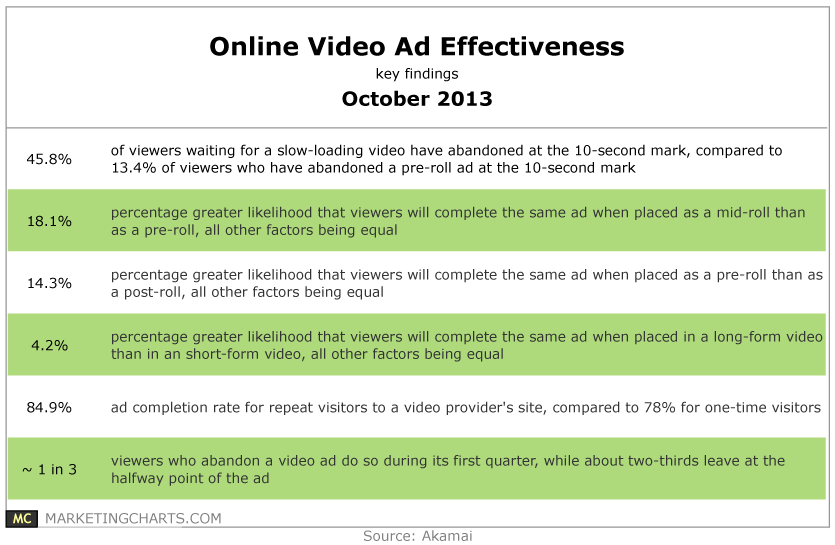
Viewers who have to wait at least 10 seconds to watch a video are 3 times more likely to abandon the video if their wait is due to slow load speeds than if its due to a pre-roll ad.
Read MoreEffectiveness Of Shopper Media, October 2013 [CHART]
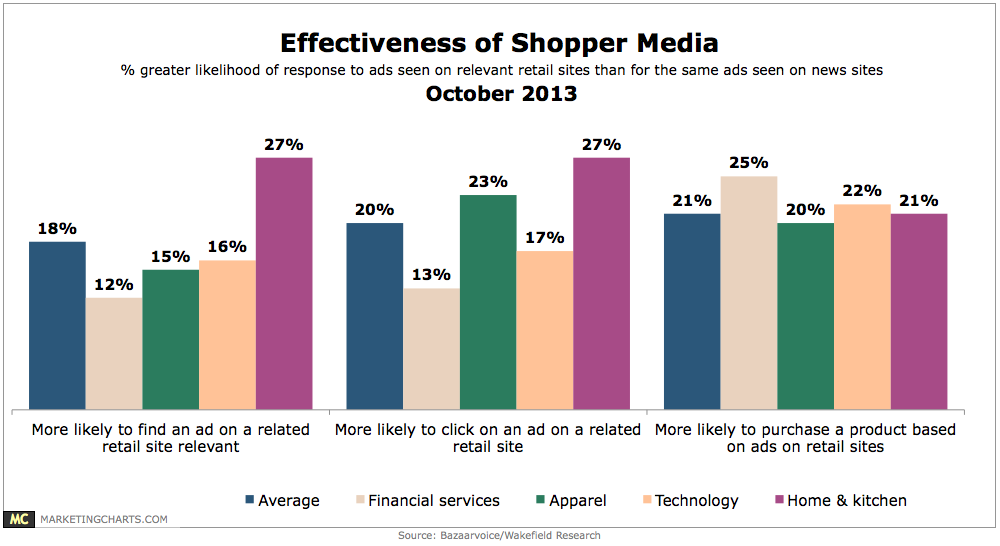
Shoppers prove more receptive to shopping ads when they see them on relevant retail sites than when they’re browsing news sites.
Read MoreReasons To Use Branded Mobile Apps By Demographic, February 2013 [TABLE]
A full 50% of US mobile device users said they used branded mobile apps in order to receive discounts and coupons.
Read MoreFacebook Brands Response Rates, Q2 2012-Q3 2013 [CHART]
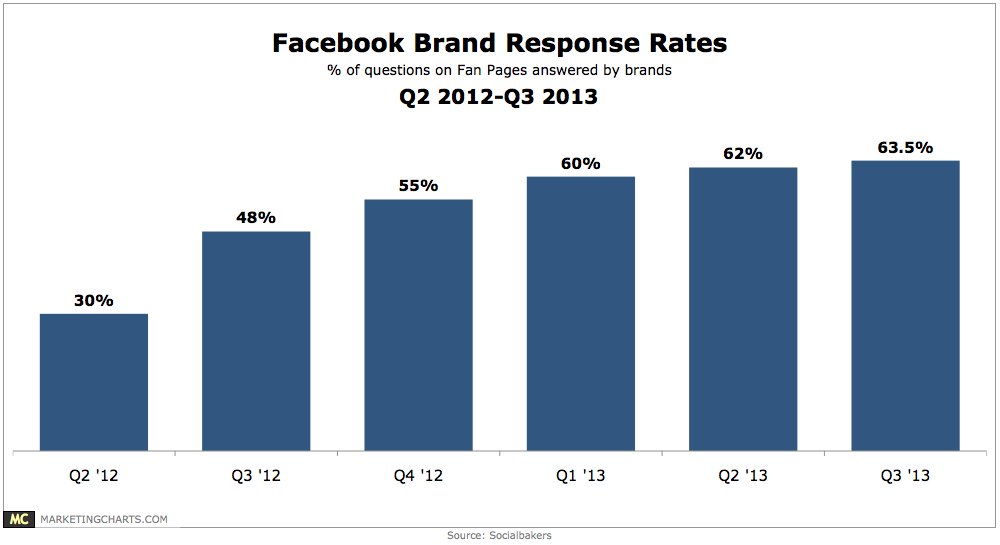
76% of the world’s most “socially devoted” brands believe that social customer service is an ROI driver.
Read MoreSocial Engagement With TV By Age Group, October 2013 [CHART]
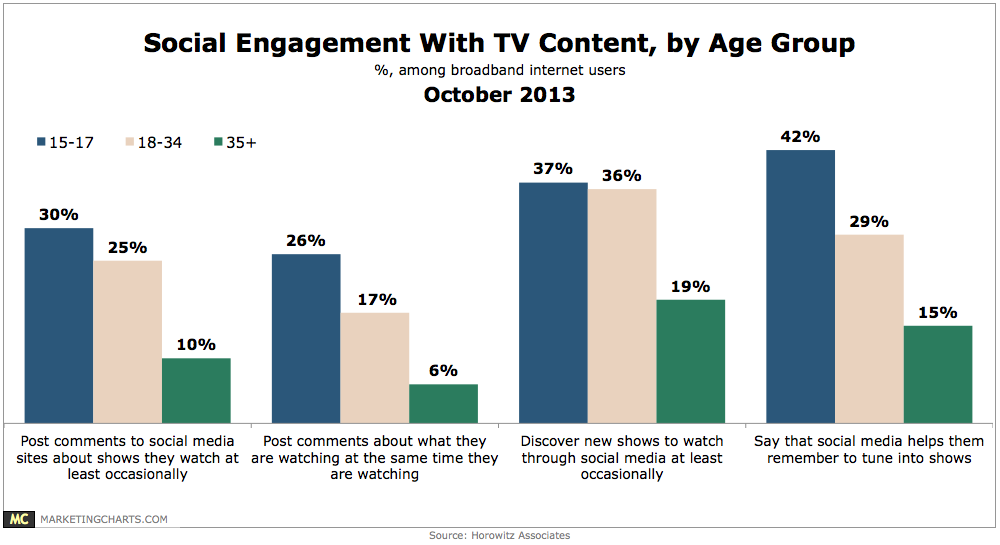
3 in 10 broadband internet users aged 15-17 say they occasionally post comments to social media sites about the TV shows they watch, a figure which remains relatively high (25%) among 18-34-year-olds, but drops to just 10% of respondents aged 35 and older.
Read MoreDesktop vs. Mobile Retail Website Visits By Day Of The Week, October 2013 [CHART]
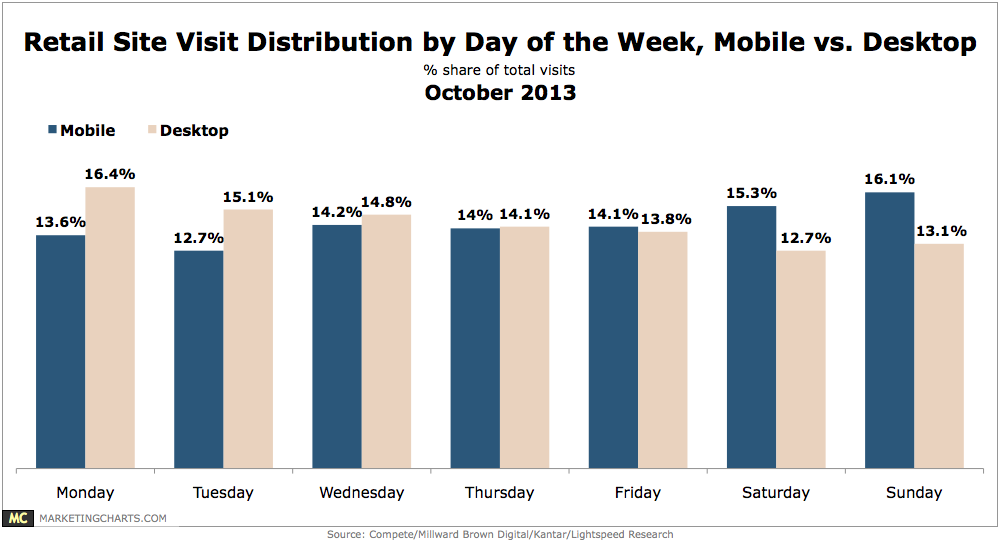
While Mondays and Tuesdays are the primary days for desktop visits (at a combined 31.5% share of total visits), Saturdays and Sundays are the most active days for mobile, with a combined 31.4% share of visits (versus 25.8% for desktops).
Read MoreDesktop vs Mobile Retail Website Visits By Daypart, October 2013 [CHART]
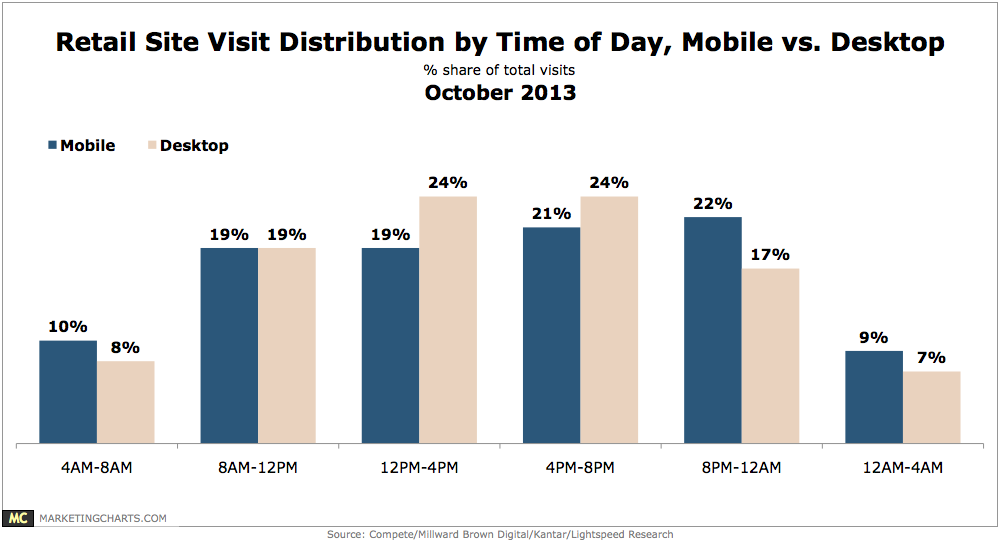
Almost half – 48% – of site visits from desktops occur between noon and 8 PM, compared to 40% of mobile visits.
Read MoreOver-The-Top Video Viewing Among Hispanic Households, October 2013 [CHART]
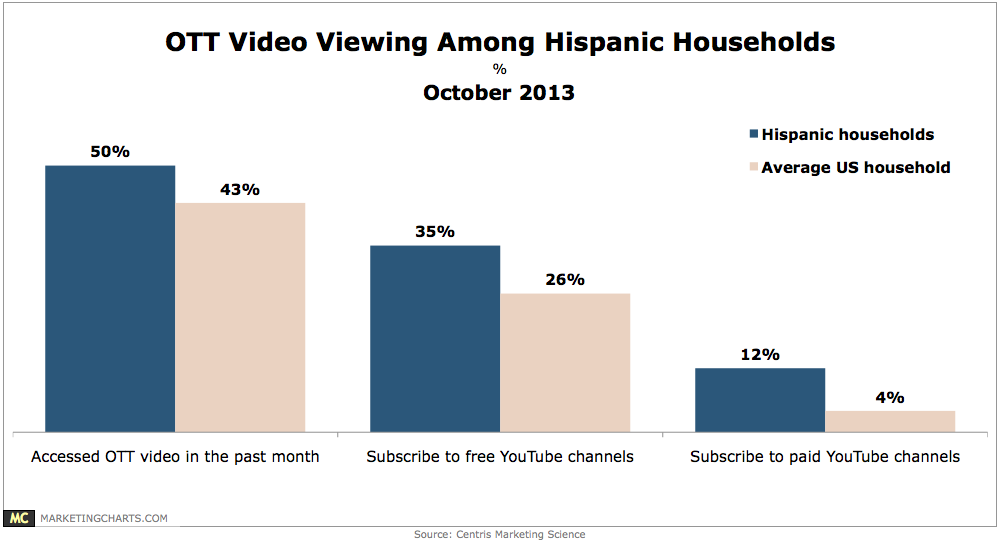
Hispanics are watching less traditional TV on a year-over-year basis, per Nielsen data, but they seem to be quite keen on over-the-top (OTT) content.
Read MoreWhat Service Providers Could Do To Prevent Customers From Switching, October 2013 [CHART]
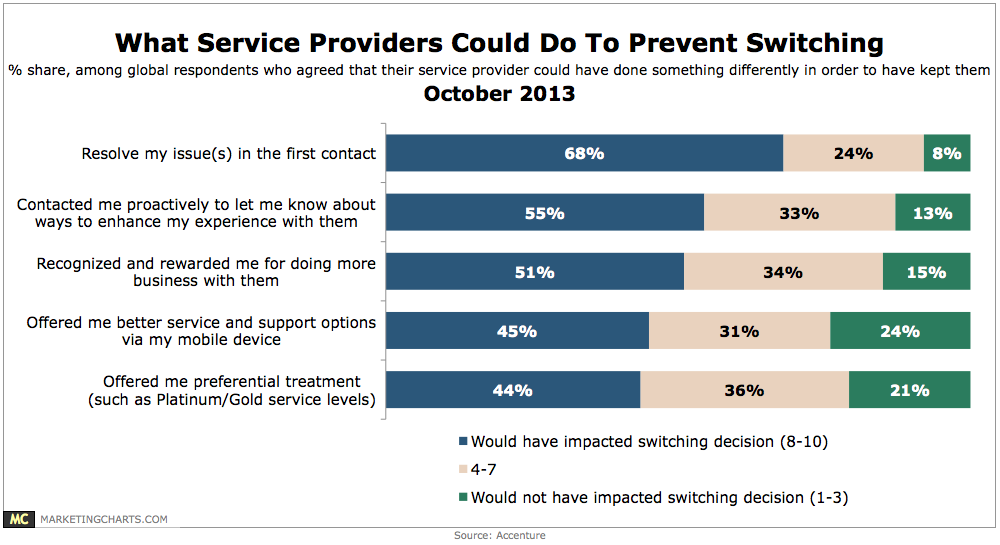
66% of consumers from 32 countries report having switched a service provider (from any 1 of 10 industries measured) during the past year.
Read More