Online Behavior
Social Engagement Rates By Post Types, Q3 2013 [CHART]
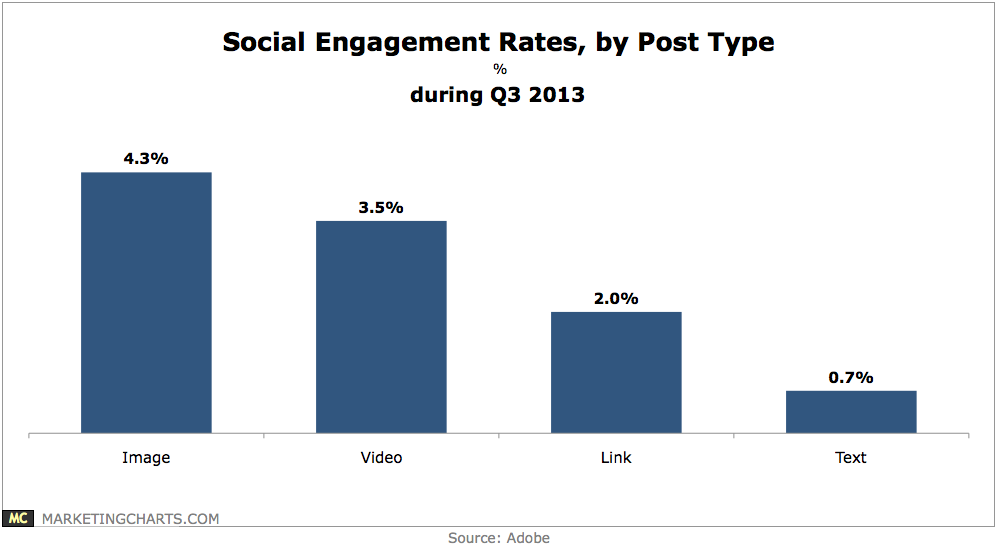
Likes account for the vast majority – 87% – of social engagement, but that share is inching back at the expense of comments and shares.
Read MoreRevenue Per Social Visit, 2012 & 2013 [CHART]
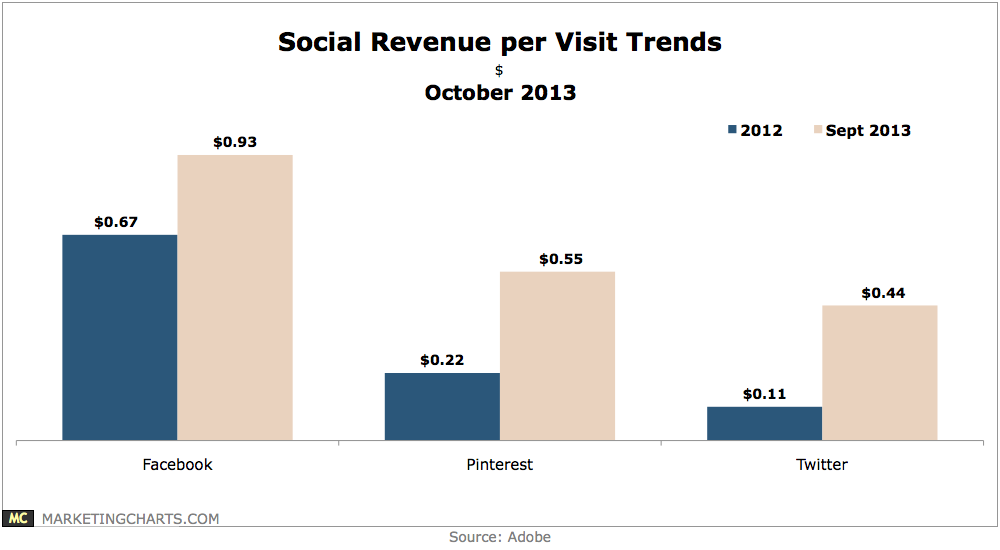
Revenue per visit grew 39% between 2012 and Q3 2013 for Facebook (to $0.93), while growing by 150% for Pinterest (to $0.55) and quadrupling for Twitter (to $0.44).
Read MoreDemographics Of Instagram Users, October 2013 [CHART]
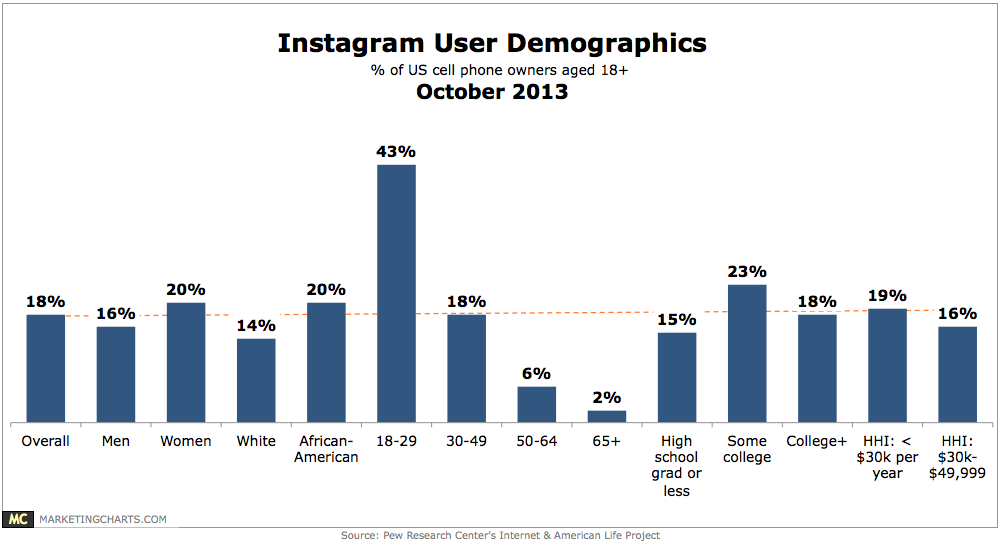
Some 20% of female cell phone users aged 18 and up use Instagram, compared to 16% of males.
Read MoreDemographics Of Snapchat Users, October 2013 [CHART]
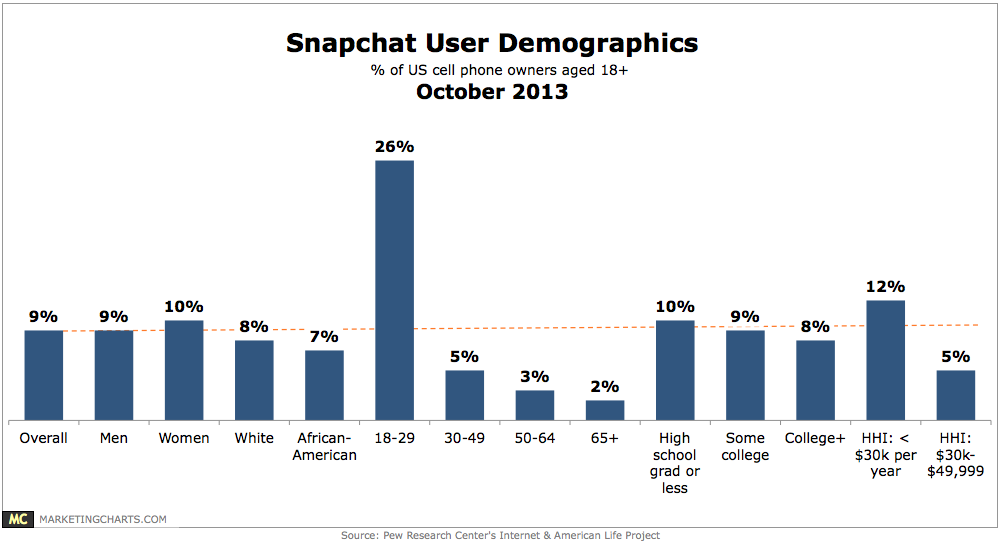
Among cell phone users, fully 26% of 18-29-year-olds report using Snapchat, a figure which plummets to 5% among 30-49-year-olds, 3% of the 50-64 crowd and 2% of those 65 and older.
Read MorePercent Of Holiday Shopping Budget Devoted To Online Purchases, September 2013 [CHART]
Thirty-eight percent of respondents said they would spend at least half of their budgets online.
Read MoreWhere American Internet Users Expect To Shop During The Holidays, 2011-2013 [TABLE]
Deloitte reports that 47% of respondents expected to shop online this holiday season, making it the most popular shopping channel.
Read MoreEffectiveness Of Social Media Sites Among B2B Users [CHART]
LinkedIn is the only platform that the majority of B2B marketers consider to be effective.
Read MoreSocial Sites Used By B2B Marketers To Distribute Content [CHART]
B2B marketers now use an average of six social media platforms to distribute content, versus five last year.
Read MoreUnique Visitors Per Year To Top Social Media Sites, 2008-2015 [CHART]
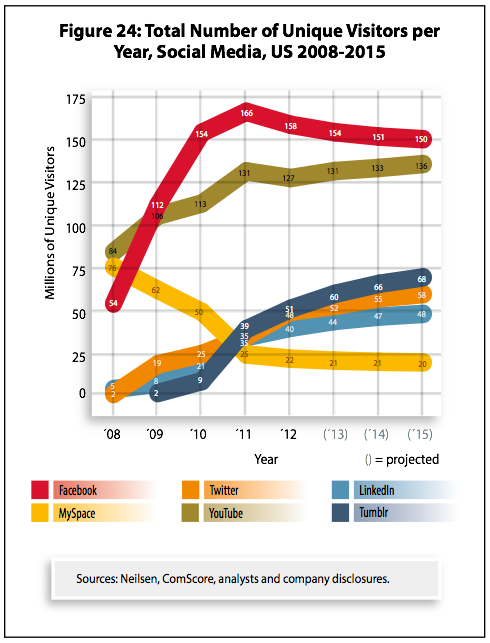
Facebook’s 31 million unique visitors lead from 2012 will drop to 14 million by 2015.
Read MoreFrequency Of Instagram Use [TABLE]
Almost three-in-ten cell owners use Instagram on a weekly basis.
Read More