Online Behavior
Frequency With Which US Mothers Occupy Their Children With Smart Phones, June 2013 [CHART]
More than one-third reported rarely or never allowing their children to use their smartphones.
Read MoreMillennial Mothers' Monthly Time Spent With Apps/Mobile Sites, June 2013 [TABLE]
In the past year alone, the number of US mothers using smartphones increased nearly 34%, BabyCenter reported in September 2013.
Read MoreConsumer Attitudes Toward Online Reviews, December 2013 [CHART]
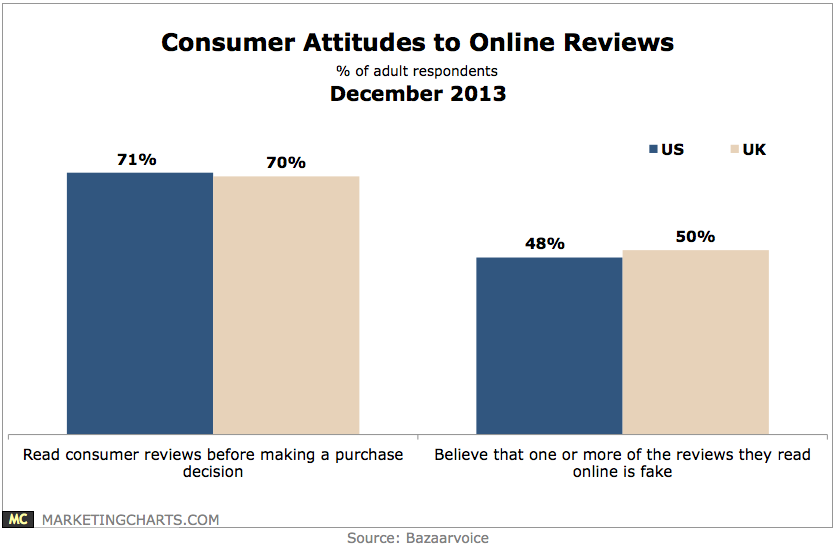
7 in 10 adult consumers in the US and UK read consumer reviews before making purchase decisions.
Read MoreTop 10 Smart Phone Apps, October 2013 [CHART]
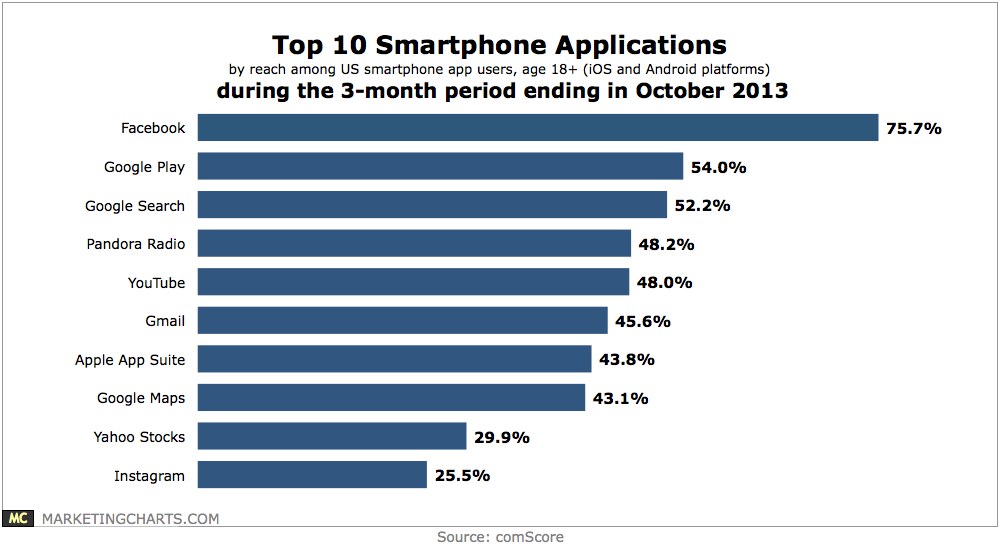
With 25.5% reach among adult iOS and Android app users, Instagram ranked as the 10th-largest smartphone application during the 3-month period ending in October 2013.
Read MoreOnline Video Ad View Share By Device & Content Duration, Q3 2013 [CHART]
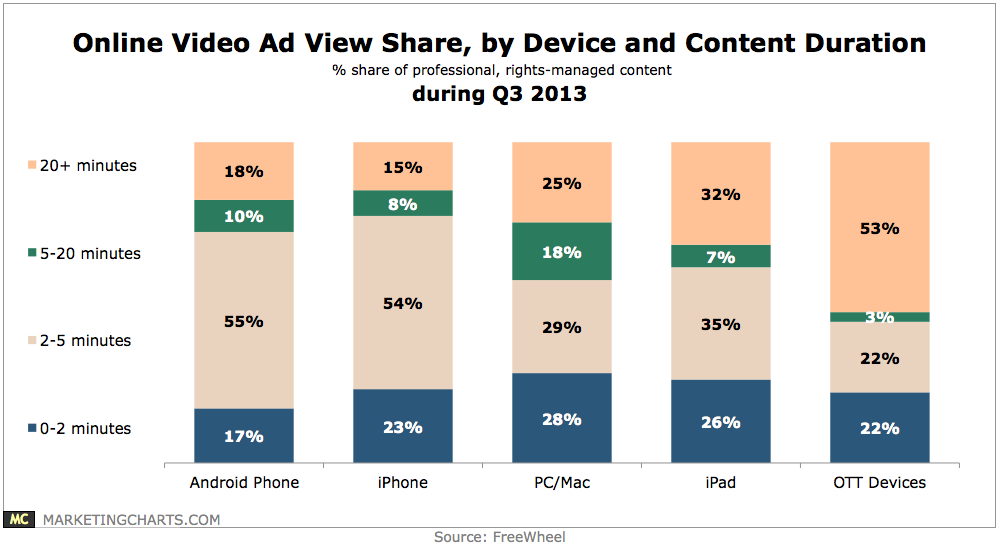
During Q3, 72% of ad views on Android phones were derived from content less than 5 minutes in length, with the corresponding figure at 77% for iPhone users.
Read MoreGlobal Mobile Gaming Revenues, 2013 & 2018 [CHART]
Newzoo determined that the market overall would grow by about 162.6% between 2012 and 2016.
Read MoreB2B Tech Buyers' Actions Prompted by Tech-Related Video, 2012 [CHART]
Digital video, long an amusement for consumers, is nudging its way into the business-to-business (B2B) marketing mainstream.
Read MoreSocial TV Behavior, Q1-Q3 2013 [CHART]
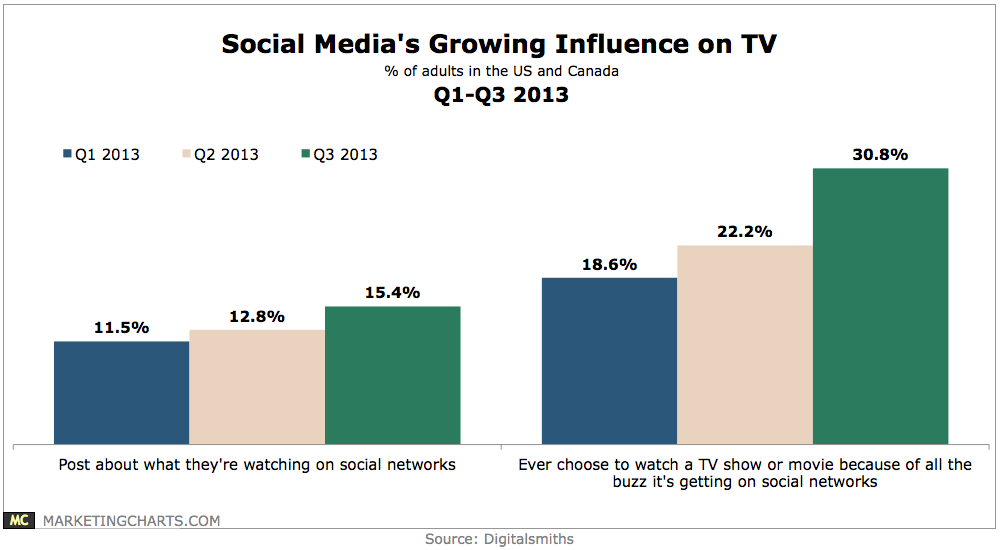
During Q3, 15.4% of adult respondents in the US and Canada claimed to post about what they’re watching, up from 12.8% in Q2 and 11.5% in Q1.
Read MoreMobile Shopping & Mobile Offers, December 2013 [TABLE]
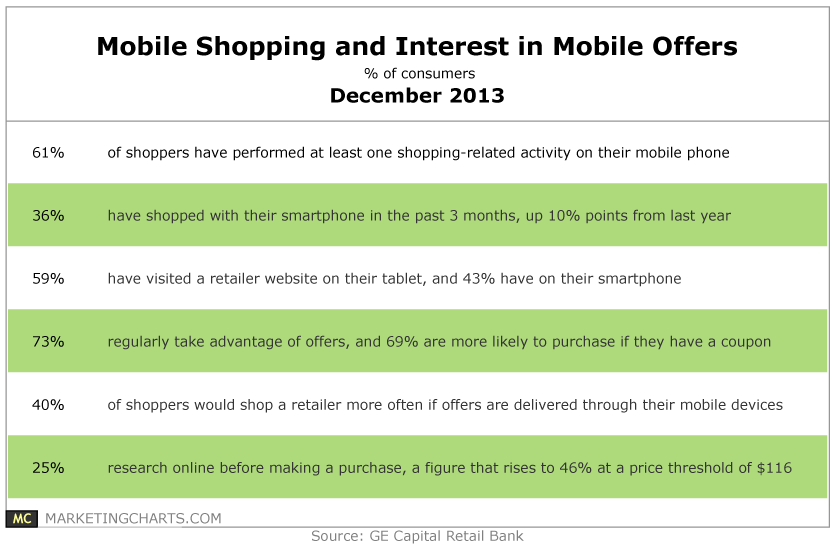
61% of respondents have performed at least a single shopping-related task on their mobile phone, and 36% have shopped on their smartphone at some point during the last 3 months.
Read MoreSocial Shares Driven By Top 3 Viral Videos Ads, 2006-2013 [CHART]
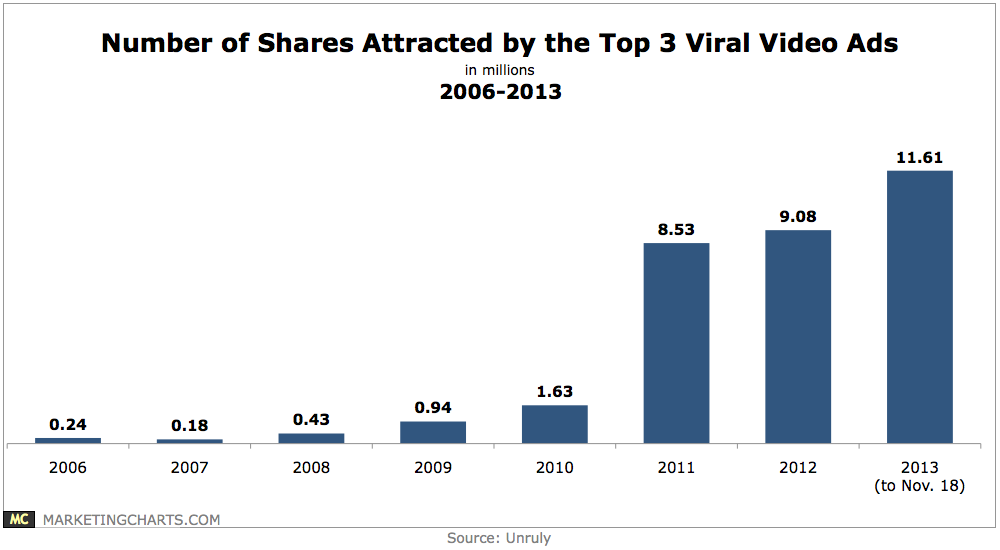
This year’s top 3 ads (through November 18) have generated 11.6 million shares, up from 1.6 million in 2010 and less than one-quarter of a million in 2006.
Read More