Online Behavior
Types Of Video People Watch On Their Smart Phones, Q3 2013 [CHART]
Just over 42% of internet users in North America watched news video content on their smart phones.
Read MorePsychology Of The eCommerce Checkout [INFOGRAPHIC]
This infographic from VoucherCloud illustrates how various factors influence the eCommerce checkout process.
Read MoreSocial Media & Narcissism [INFOGRAPHIC]
This infographic by NowSourcing makes the argument that social media is making society more narcissistic.
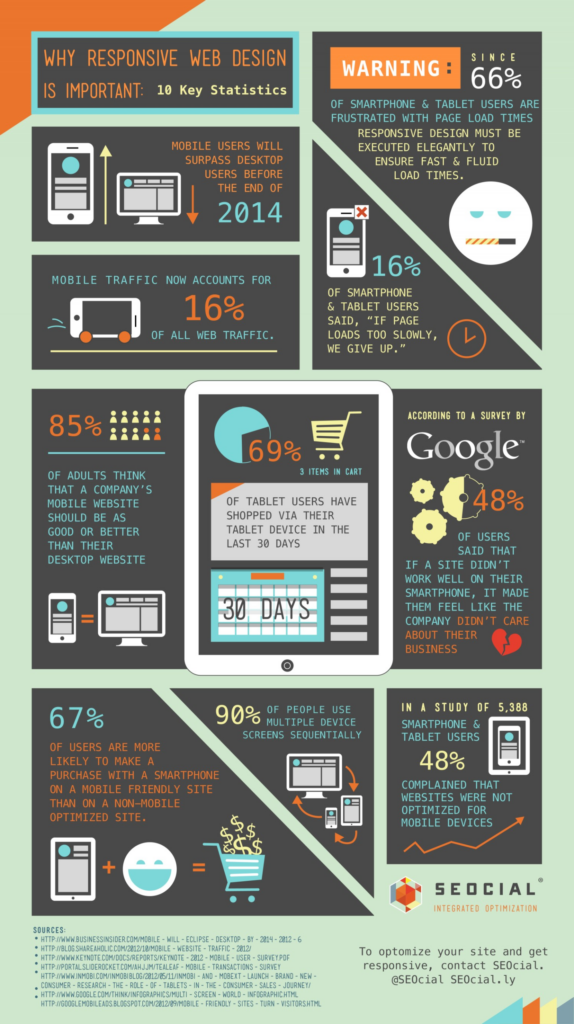
Read MoreImportance Of Responsive Design [INFOGRAPHIC]
This infographic by SEOcial illustrates 10 key statistics that highlight the importance of responsive design.
Read MoreGrowth Of mCommerce [INFOGRAPHIC]
This infographic by Judo illustrates the growth of mCommerce.
Read MoreBooks Vs. Movies [INFOGRAPHIC]
This infographic from LoveReading.co.uk illustrates which is more popular according to online reviews, the book or the movie upon which it is based.
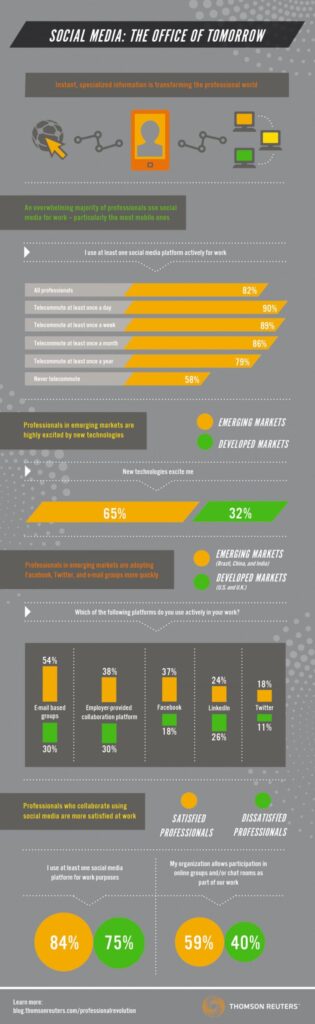
Read MoreSocial Media At The Office [INFOGRAPHIC]
This infographic from Thomson Reuters illustrates social media use at the office.
Read MoreDigital Shopping Tools That Most Influence Their Users, December 2013 [TABLE]
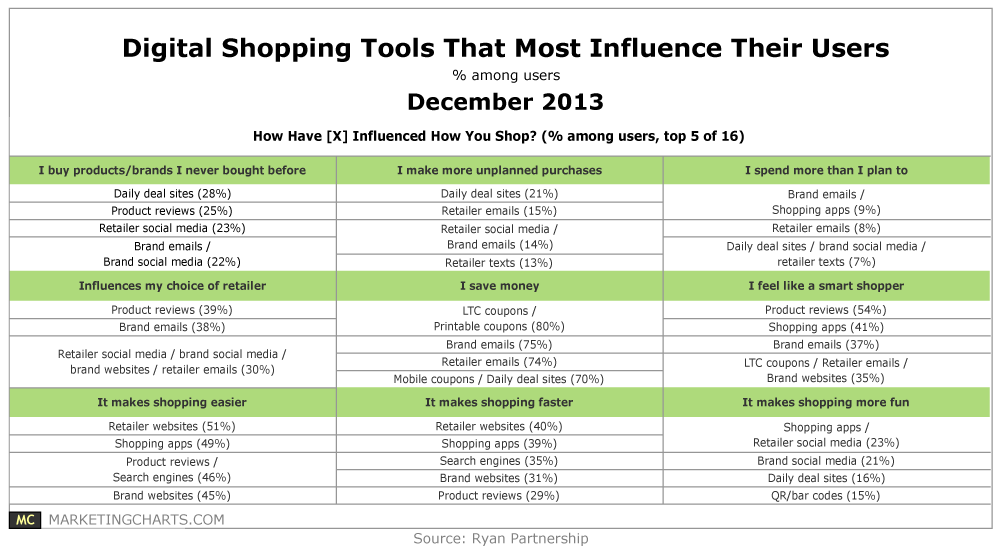
At least 8 in 10 respondents are aware of traditional tools such as retailer websites (86%), search engines (84%), and printable coupons (81%), with newer tools such as mobile coupons (59%), shopping apps (54%) coming on strong.
Read MoreComputer Activities Now Performed On Tablets, December 2013 [CHART]
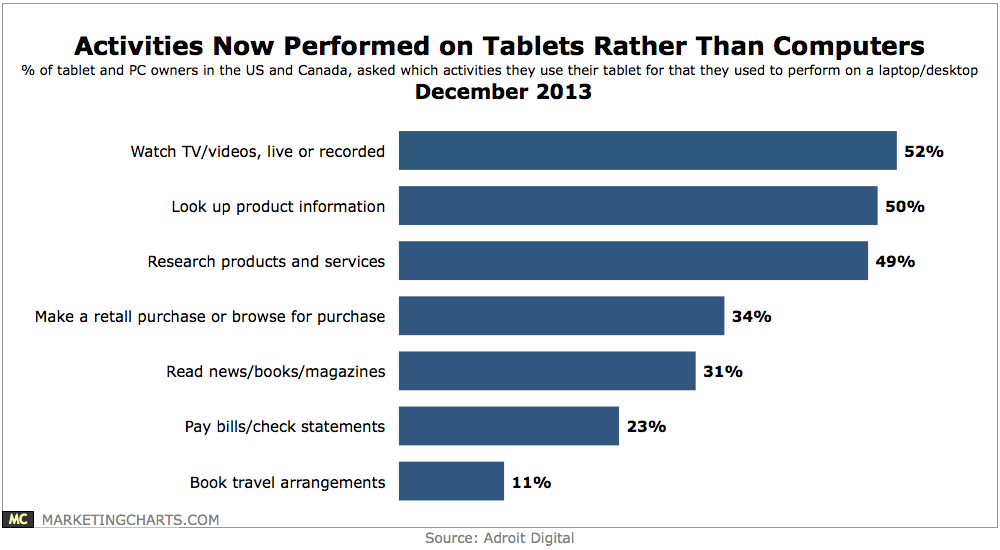
55% of respondents who own both devices would consider purchasing a tablet as a replacement for their personal laptop or desktop.
Read MoreSmart Phone Users & Downtime, December 2013 [CHART]
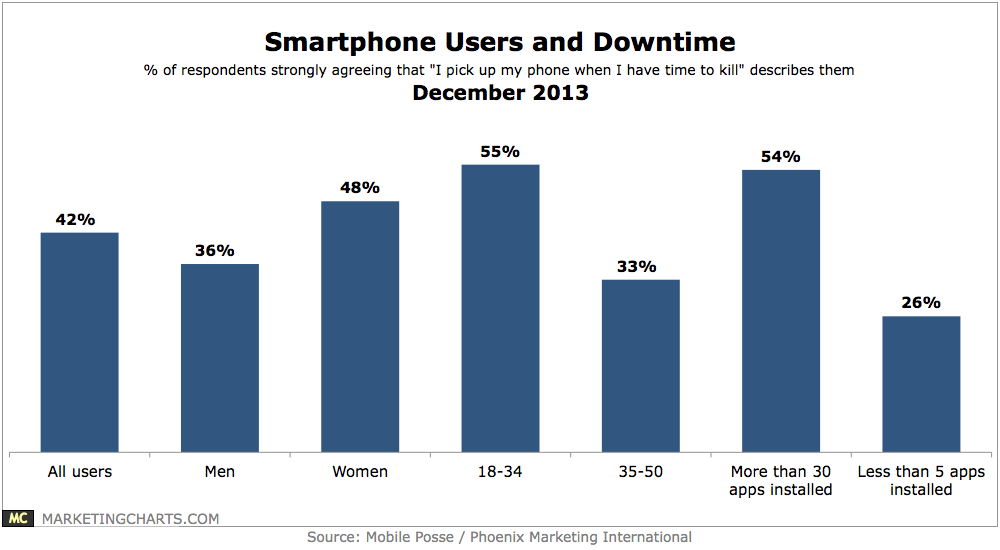
42% of respondents strongly agree that they pick up their phones when they have time to kill.
Read More