Online Behavior
Online TV Show Sources Used By Primetime TV Viewers, January 2014 [CHART]
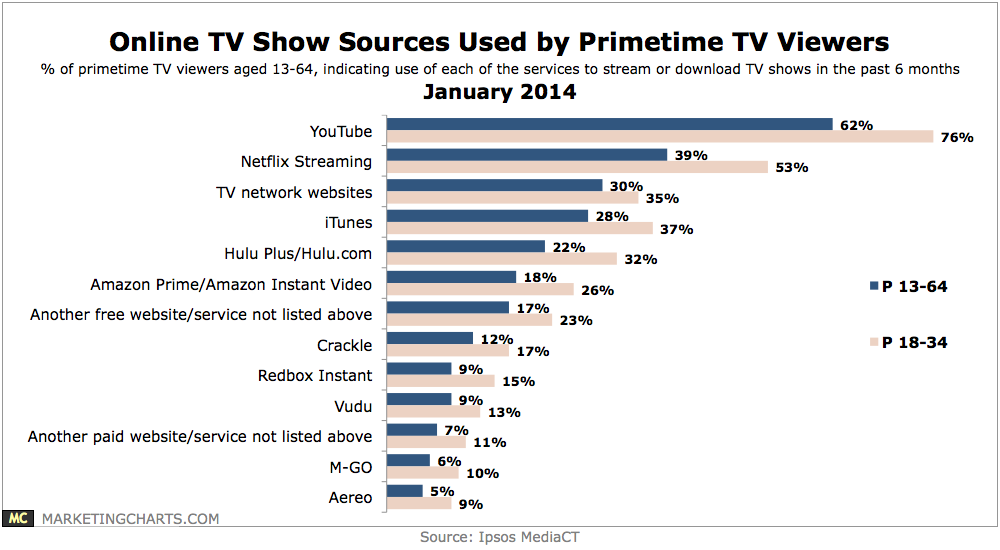
3 in 4 primetime TV viewers between the ages of 13 and 64 have used an online service to stream or download TV shows during the past 6 months.
Read MoreHow People Find New Mobile Apps, March 2013 [CHART]
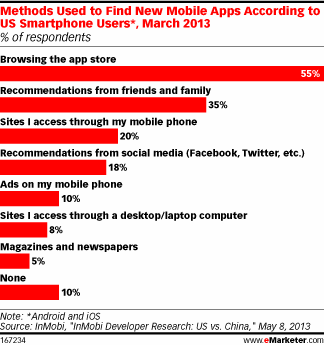
55% of US smartphone users typically browsed the app store to find new mobile apps.
Read MoreGlobal Mobile App Downloads, 2013 & 2017 [CHART]
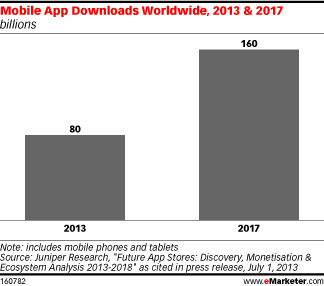
Portio Research estimated the number of annual downloads would top 200 billion in 2017—two-and-a-half times 2013’s 82 billion.
Read MoreAmericans' Small-Ticket Budget Cutbacks, November 2012 vs December 2013 [CHART]
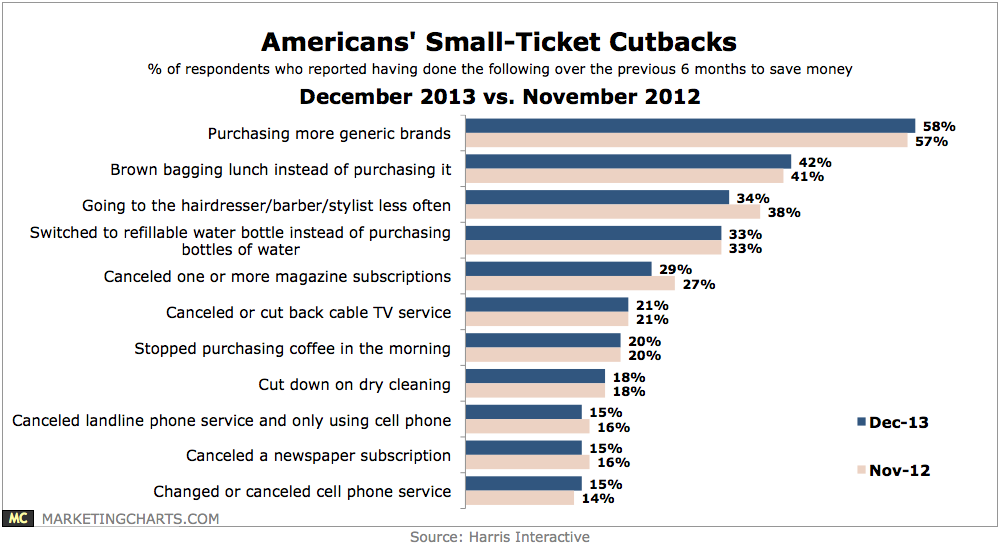
Americans ended 2013 slightly less likely to have been cutting back on small-ticket items to save money than they had been earlier on in the year.
Read MoreShare Of Search Ad Clicks, Q4 2012 – Q4 2013 [CHART]
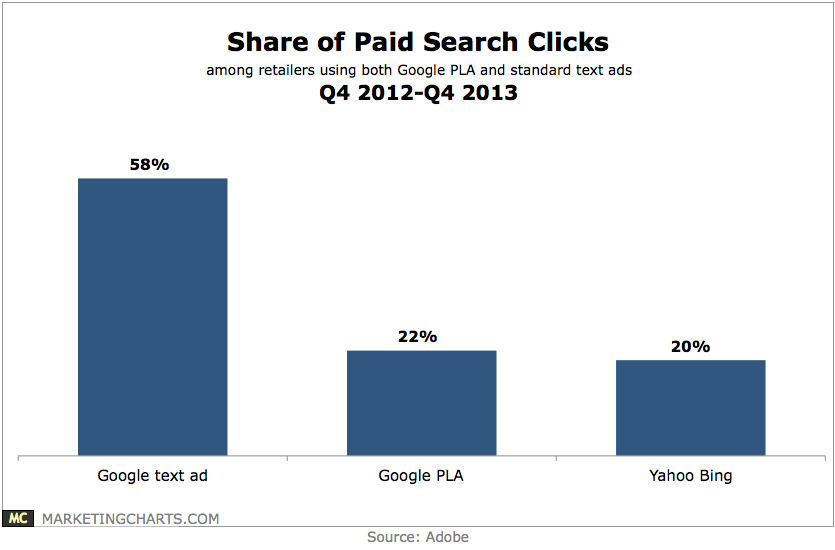
Cost-per-click for Google product listing ads (PLAs) jumped by 80% year-over-year during Q4 2013, all the while maintaining a relatively steady ROI.
Read MoreOnline Video Discovery Methods, January 2014 [CHART]
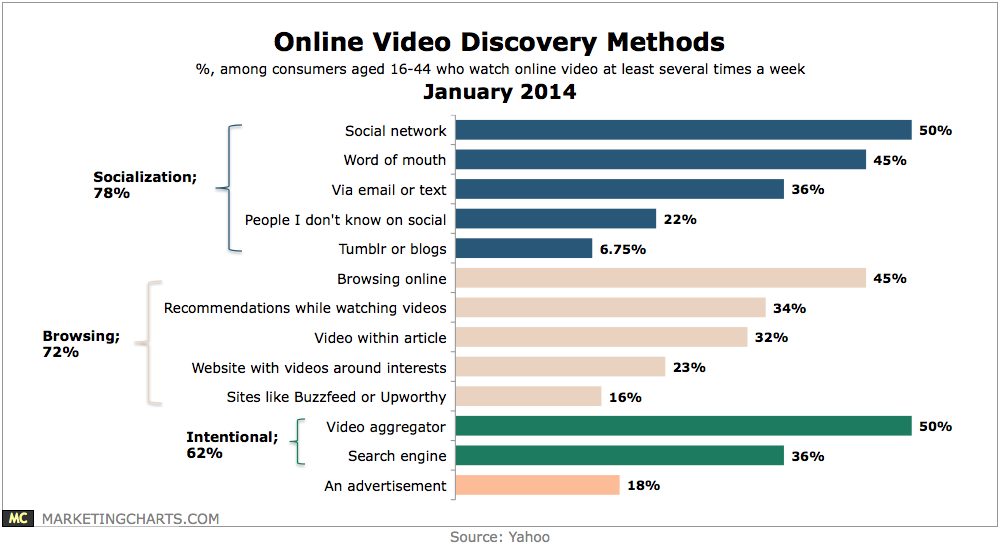
Almost 8 in 10 find videos through social means, with 50% finding them through their social network and 45% from word-of-mouth.
Read MoreTablet Experience Preferences, January 2014 [CHART]
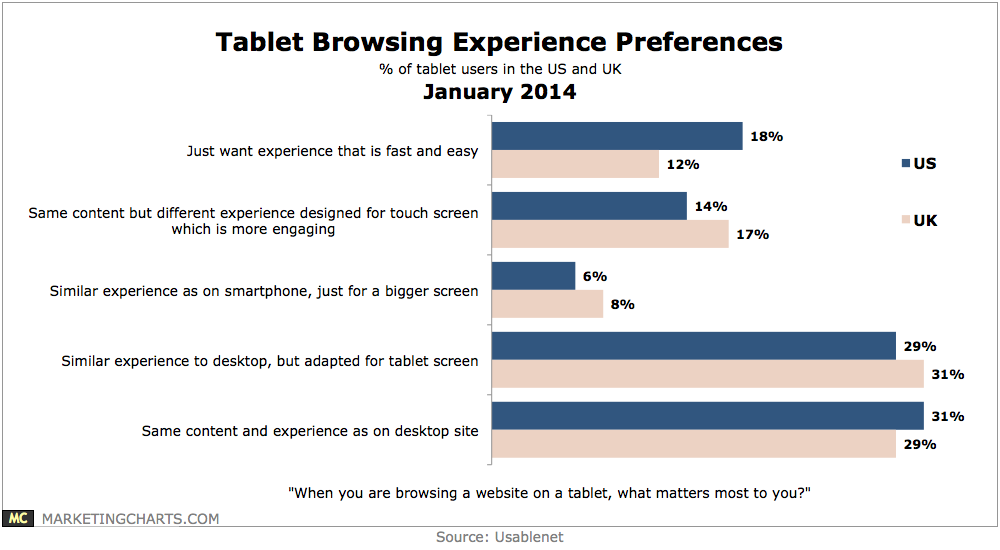
Fewer than 1 in 10 want an experience similar to the smartphone but on a bigger screen.
Read MoreFacebook Mobile Users & Ad Revenues, Q3 2012 – Q4 2013 [CHART]
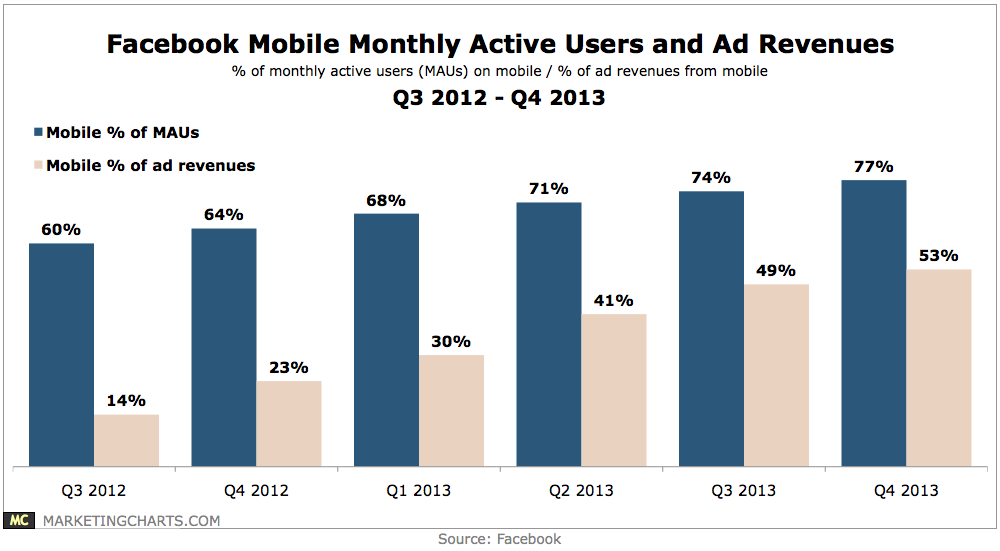
Facebook has crossed a threshold of sorts, with mobile now comprising a majority 53% share of its growing ad revenues.
Read MoreDevices Used To Read eBooks, December 2011 vs January 2014 [CHART]
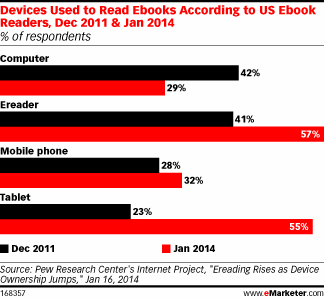
A preference for dedicated eReaders over tablets seems to be eroding among eBook readers.
Read MoreAmericans Who Have Read A Book vs eBook In The Past Year, 2011-2014 [CHART]
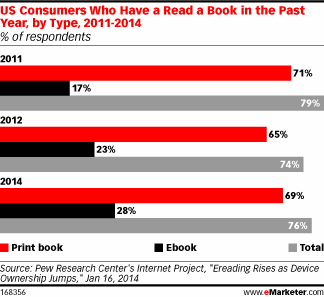
The percentage of respondents who had read a print book over the preceding 12 months had dipped and then rebounded between 2011 and 2014, while the use of ebooks had seen steady gains.
Read More