Online Behavior
Long-Form Video Share Of Time Watched By Device, Q4 2013 [CHART]
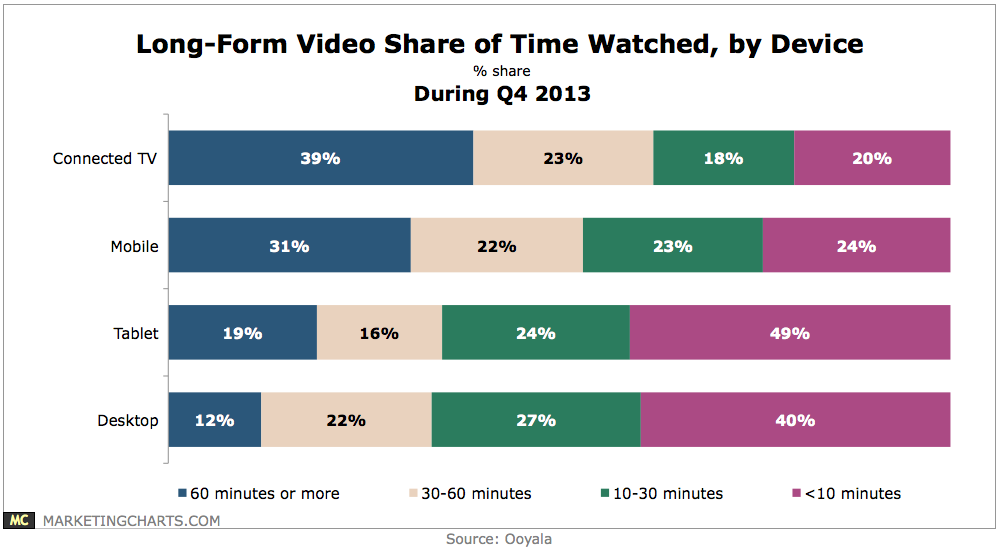
The majority of mobile video viewing time in Q4 2013 was spent with content at least a half-hour in length.
Read MoreFacebook Metrics In The Middle East & Africa By Age, January 2014 [TABLE]
Facebook users in the Middle East and North Africa—Egypt, Iraq, Jordan, Kuwait, Lebanon, Morocco, Oman, Qatar, Saudi Arabia, Syria and the UAE—skewed young.
Read MoreAd Pros Who Have Used Twitter Ads For Social TV, December 2013 [CHART]

22% of US advertising professionals said they’d bought Twitter ads in conjunction with a TV ad campaign.
Read MoreInc. 500's Social Media Use, 2012 vs 2013 [CHART]
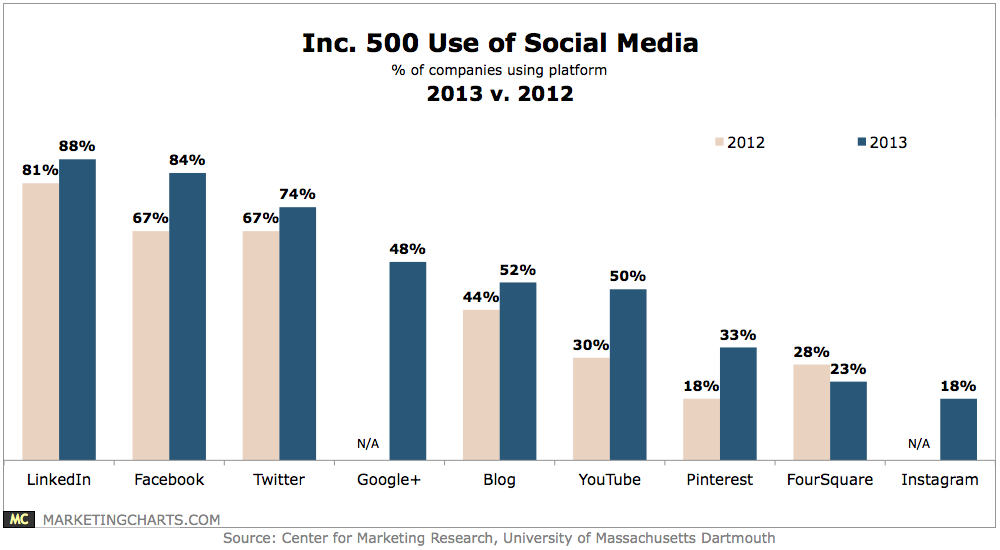
Virtually all – 95% – of the 2013 Inc. 500 companies are using at least one major social media tool.
Read MoreMedia Gender Gap [INFOGRAPHIC]
Male journalists make up 63% of bylines in print, Internet and wire news media, according to a recent report from the Women’s Media Center.
Read MoreUS Mobile Banking Demographics, March 2014 [CHART]
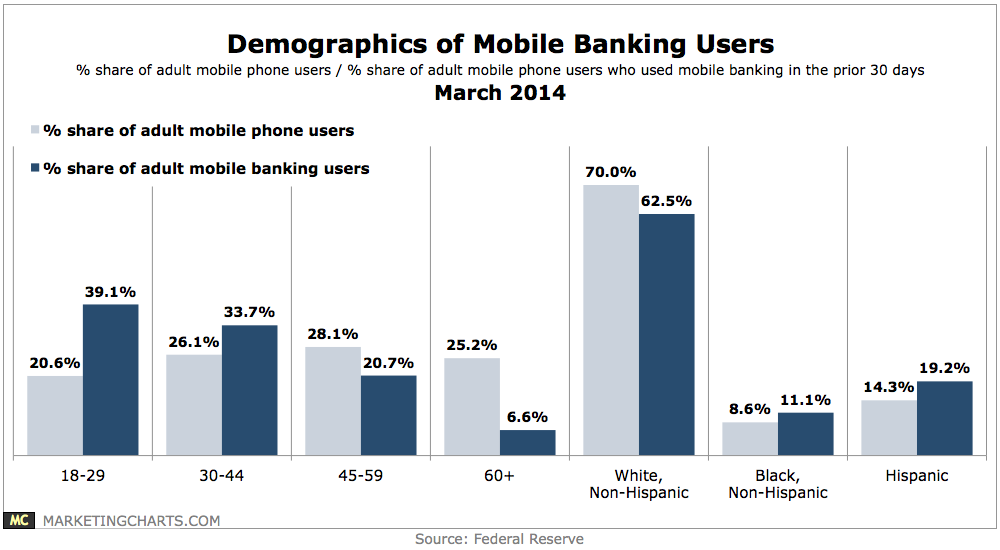
33% of mobile phone owners had used mobile banking during the 30 days prior to the survey, up from 28% a year earlier.
Read MoreMobile Ad-Friendly Shoppers & Social Media, March 2014 [TABLE]
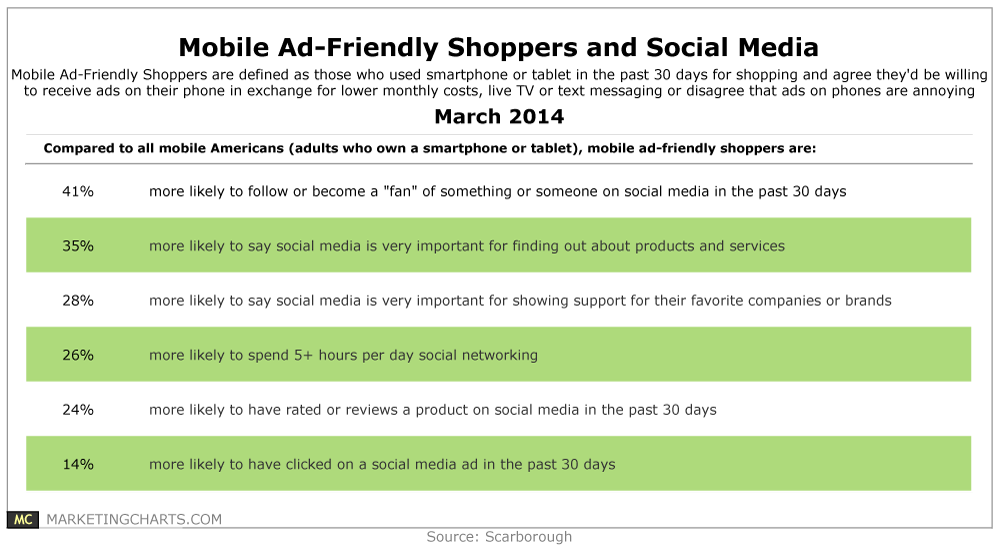
About half of smartphone and tablet owners are willing to receive ads on their devices in exchange for services.
Read MoreMarketers' Changing Roles, March 2014 [CHART]
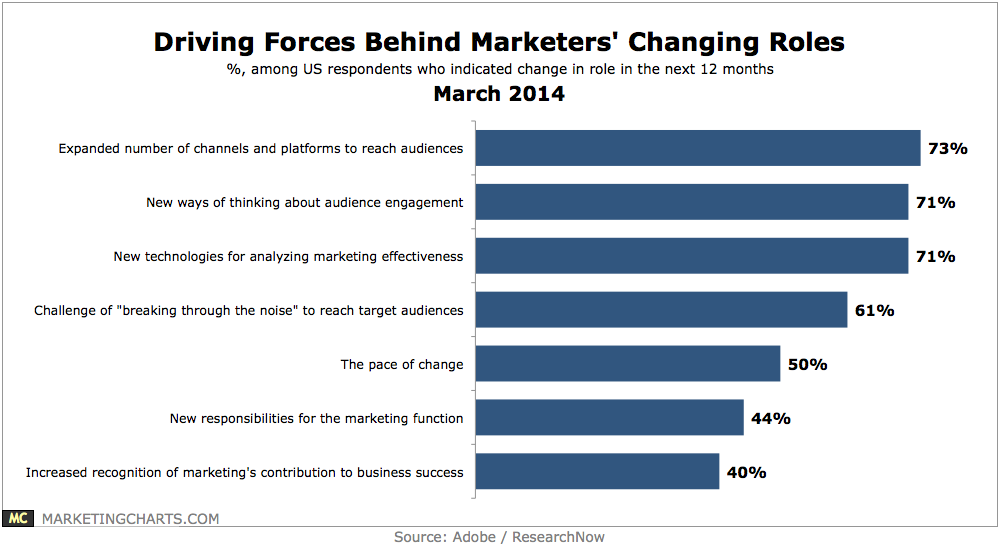
Close to two-thirds of US marketers surveyed believe their roles as marketers will change in the next 12 months, while 4 in 5 feel that their roles will change in the next 3 years.
Read MoreUK Entertainment Sales Share, 2013 [CHART]
Access Services grew their share of entertainment sales by 35.6% to reach 26% of the entertainment retail market.
Read MoreUK Entertainment Sales By Category & Channel, 2013 [TABLE]
Internet-derived sales rose 13.9% year over year in 2013 to account for 60.0% of the UK entertainment retail market.
Read More