Online Behavior
B2B Technology Buying Cycle [INFOGRAPHIC]
This infographic from Scribewise illustrates the B2B technology buying cycle.
Read MoreiPhone Use Rates By State [MAP]
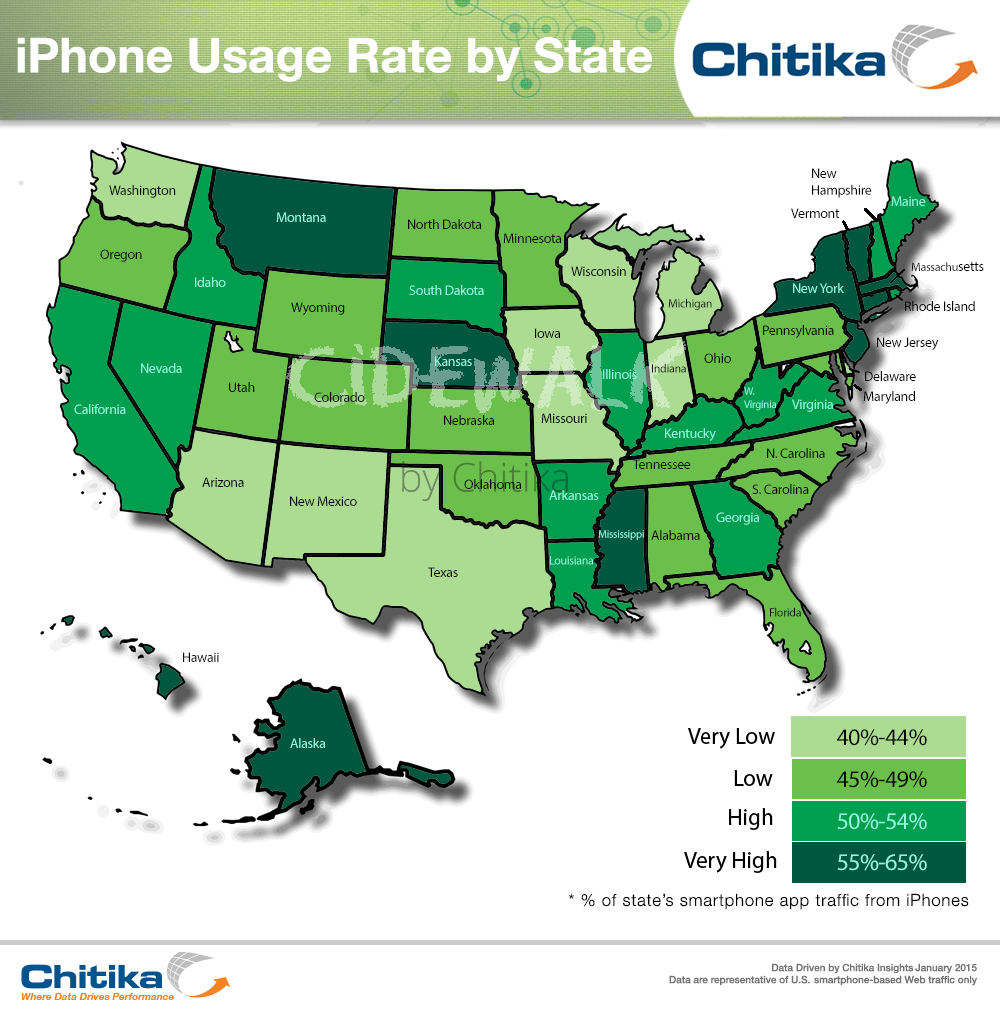
This infographic illustrates how state-by-state iPhone usage rates correlates with education level and population density. Read more at Chitka.
Read MoreEmail Marketing Benchmarks, 2012 & 2017 [CHART]
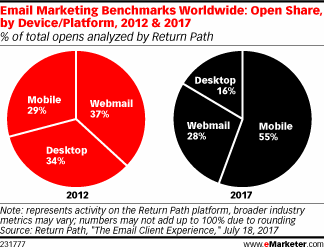
The world of email marketing has changed pretty significantly over the past five years. Where desktop clients like Outlook were once a more important delivery medium, readers of email are now in the thrall of mobile clients and webmail services like Gmail.
Read MoreLinkedIn Tips & Tricks [INFOGRAPHIC]
This infographic from Onstride Financial illustrates some tips and tricks for optimizing your LinkedIn profile.
Read MoreBlack & Hispanic Mobile Audio Streaming [CHART]
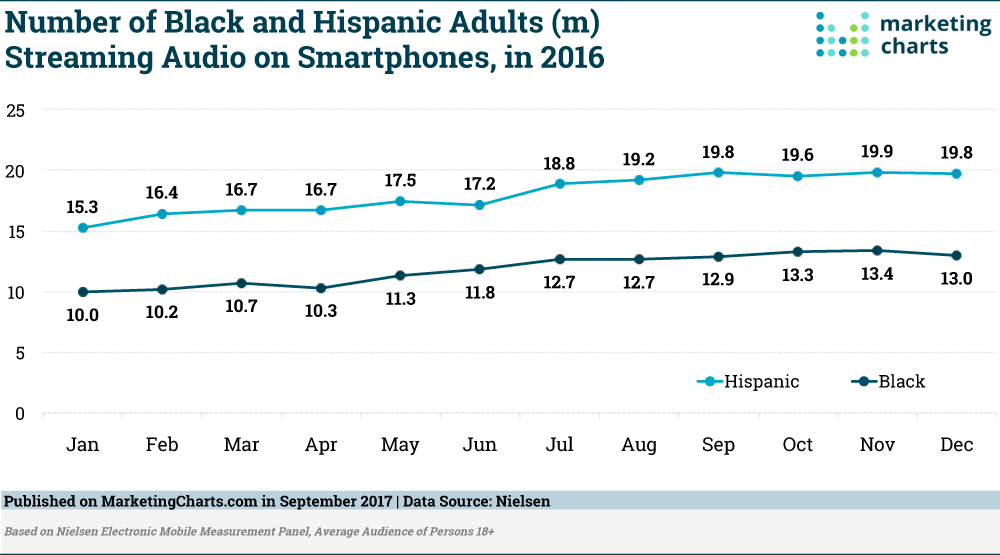
81% of Black adults and 91% of Hispanic adults using smartphones on a weekly basis as of Q4 2016, these devices are increasingly being used for streaming.
Read MoreWhere Consumers Conduct Product Research Online [CHART]
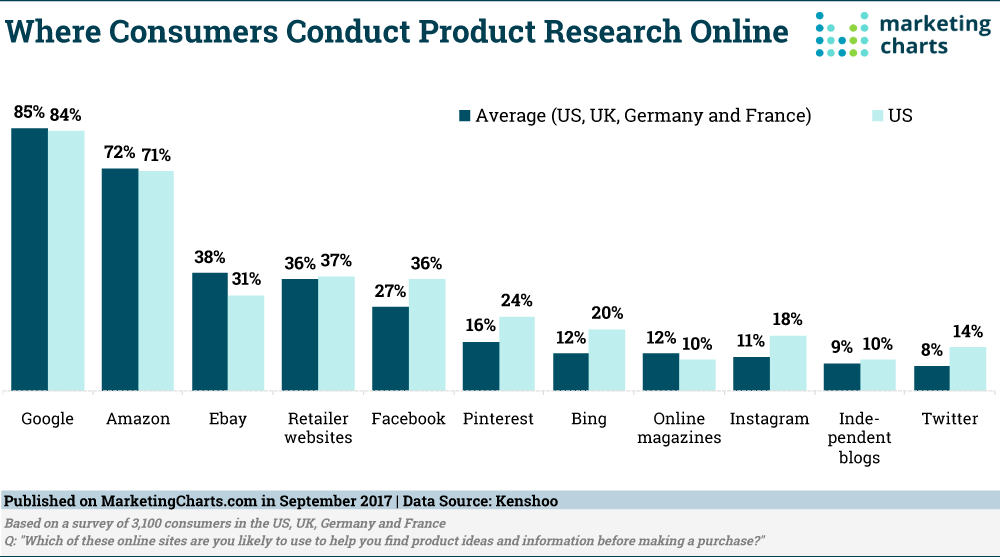
More respondents turn to Google (85%) than to Amazon (72%) to help them find product ideas and information before making a purchase.
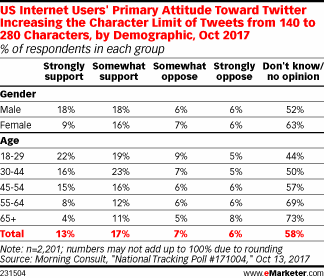
Read MoreAttitudes Toward Twitter's Increased Character Count [TABLE]
41% of respondents ages 18 to 29 having at least a somewhat positive reaction to the change, and just 14% expressing reservations.
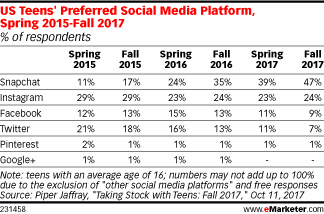
Read MoreTeens' Preferred Social Media Channels, 2015-2017 [TABLE]
Nearly half of US teens say they prefer Snapchat over other social media sites, including Instagram, Twitter and Facebook.
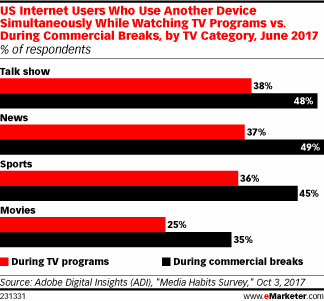
Read MoreMultitainment Activities [CHART]
Many people use another device, primarily a smartphone, while simultaneously watching TV.
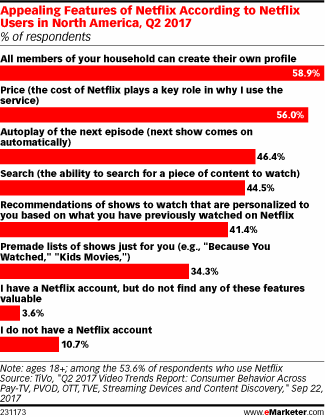
Read MoreMost Popular Netflix Features [CHART]
More than 85% of cord-cutters said that pay TV services were too expensive, and that cost was one of the main reasons they chose to cancel their cable or satellite service.
Read More