Online Behavior
Facebook Brand Posts Engagement By Day Of The Week, Q1 2014 [CHART]
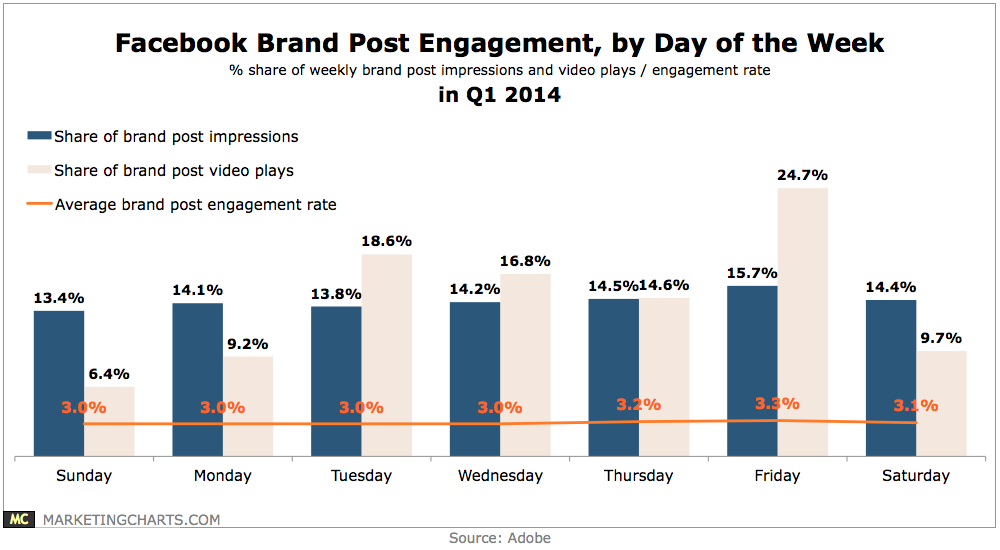
Friday boasted the largest share (15.7%) of Facebook brand post impressions during Q1, as well as the highest engagement rate (3.3%) and share of brand post video plays (24.7%).
Read MoreMobile Behavior Of UK Tablet Owners By Demographic, November 2013 [TABLE]

Of the 20 million mobile gamers in the UK, almost half were female.
Read MoreDemographic Profile Of UK Mobile Gamers, September 2013 [CHART]
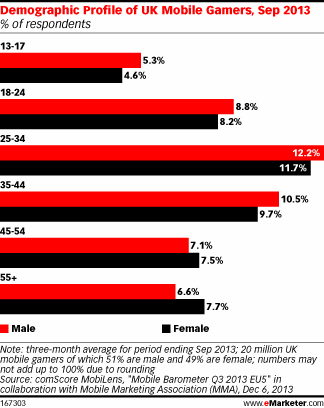
One is as likely to find UK women playing casual games on mobile devices, an activity that has long been considered a predominantly male pastime.
Read MoreGrowth Of Average Daily Time Spent With Major Media, 2011-2014 [TABLE]
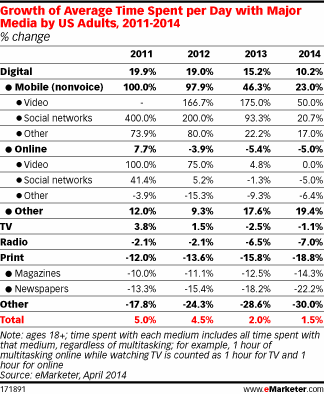
US advertisers are only expected to spend 10 cents per US adult per hour spent on digital media this year—and just 7 cents on mobile—compared with nearly $1 on print ads.
Read MoreUS Major Media Ad Spending Per Hour Spent With Media, 2010-2014 [TABLE]
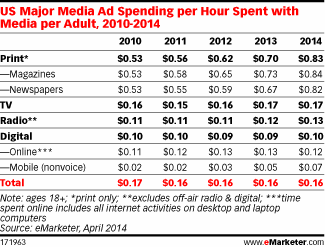
Print still commands the most ad dollars—despite the fact that it’s losing in terms of absolute time spent with media at double-digit rates each year since at least 2011.
Read MoreCord-Cutting Intentions, April 2014 [CHART]
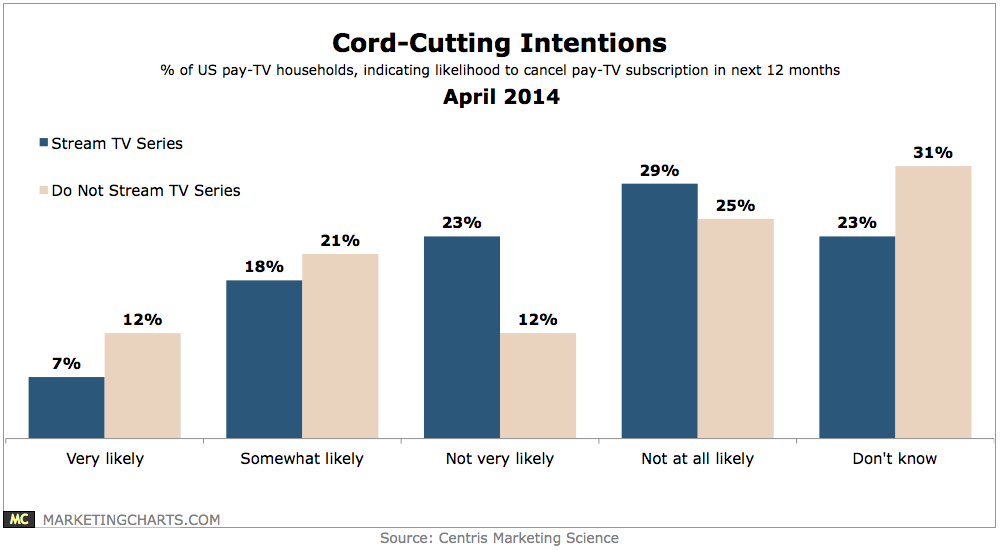
Pay-TV households who stream TV series are actually less likely to cancel their pay-TV subscriptions than those who don’t stream.
Read MoreAmericans' Daily Consumption Of Major Media, 2010-2014 [CHART]
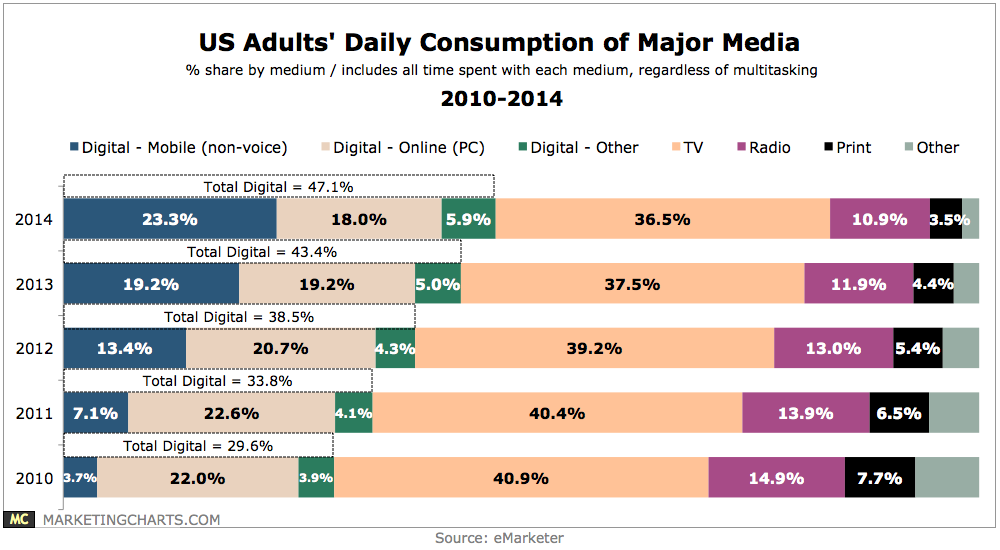
TV remains the single most-consumed medium, averaging 4 hours and 28 minutes per day, though that figure varies widely by age group.
Read MoreAverage Daily Time Spent On Social Networks By Device, 2014 [CHART]
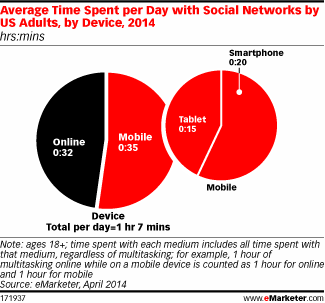
Social network usage among US adults has made the switch to majority-mobile this year.
Read MoreAverage Daily Time Spent Watching Video By Device, 2010-2014 [TABLE]
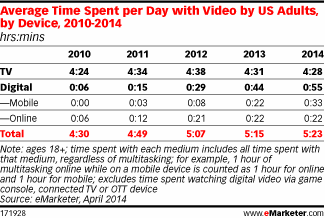
Mobile still accounts for a relatively small share of overall TV/video content viewing time, with an average of 33 minutes per day in 2014 out of a total 5 hours 23 minutes across all devices.
Read MoreShare Of Daily Time Spent With Major Media, 2010-2014 [TABLE]
In 2013, time spent with digital media among US adults surpassed time spent with TV for the first time—with mobile driving the shift.
Read More