Online Behavior
Facebook Brand Post By Time of Day, June 2014 [CHART]

The most popular hour for brands to post on Facebook is 12-1PM EST.
Read MoreFrench 2014 World Cup Watchers By Device [CHART]
Out of the 57% of internet users in France who said they would follow at least some of the tournament’s games, just 9% planned to use a smartphone to do so.
Read MoreLikelihood Pay TV Subscribers Will Cut The Cord, 2011-2014 [TABLE]
The percentage of pay TV subscribers who were likely to cancel their cable services had held steady between 2011 and 2014.
Read MoreReasons People Watch TV Everywhere, November 2013 [CHART]
Flexibility is the main reason today’s busy, on-the-go consumers are taking advantage of TV Everywhere.
Read MoreMonthly TV Everywhere Videos Viewed By Device, Q1 2013 & Q1 2014 [CHART]
The number of unique TV Everywhere visitors in the US rose 157% between Q1 2013 and Q1 2014 and 49% between Q4 2013 and Q1 2014.
Read MoreTide Culturejacks Game Of Thrones & Google+ Thumbnails Are Going Away [VIDEO]
Episode 54 of the Beyond Social Media show: David Erickson & BL Ochman discuss Tide’s culturejacking of Game of Thrones and Google+’s vanishing thumbnails.
Read MoreMobile Email Benchmarks By Industry, Q1 2014 [CHART]
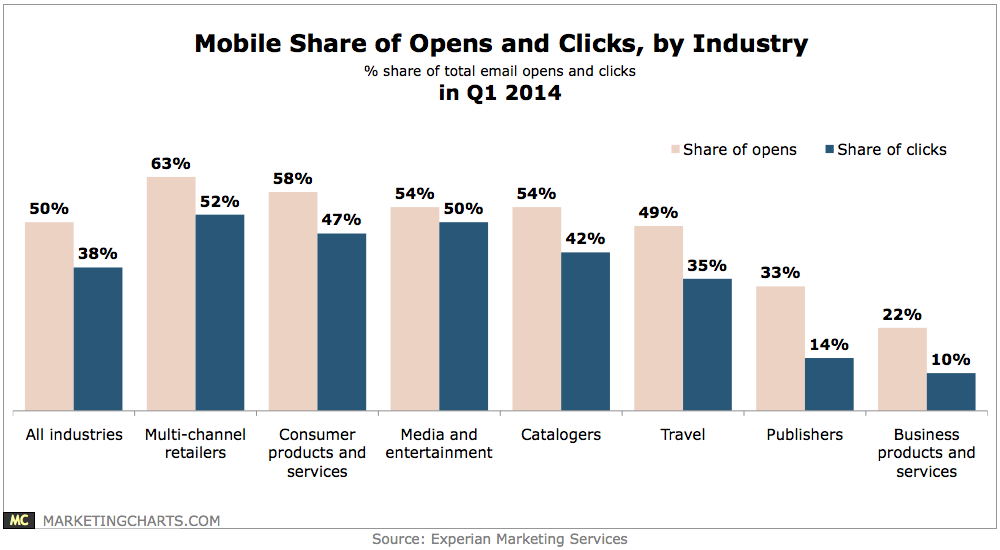
Half of total email opens occurred on a mobile device in Q1 2014.
Read MoreAverage Order Value By Social Channel, Q1 2013 vs Q1 2014 [CHART]
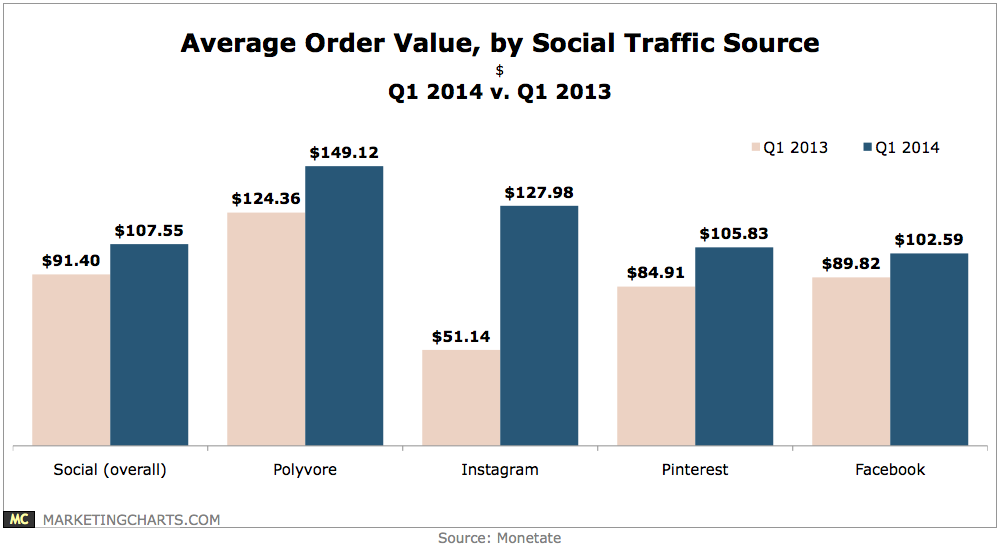
Social traffic to e-commerce sites continues to underperform relative to search traffic but is gaining in some key areas.
Read MoreUK Mobile Social Networkers, 2012-2018 [TABLE]
The boom times for social network adoption in the UK look to be largely over, as new user growth is set to slow to a near standstill by 2018.
Read MoreUS Smart TV Users vs Dumb TV Users, 2012-2018 [CHART]
The share of smart TV users as a percentage of connected TV users will decrease slightly between 2014 and 2018, while the portion of smart TV non-users will rise.
Read More