Online Behavior
Top Retail Brands' Site Load Speeds, 2013 – 2014 [CHART]
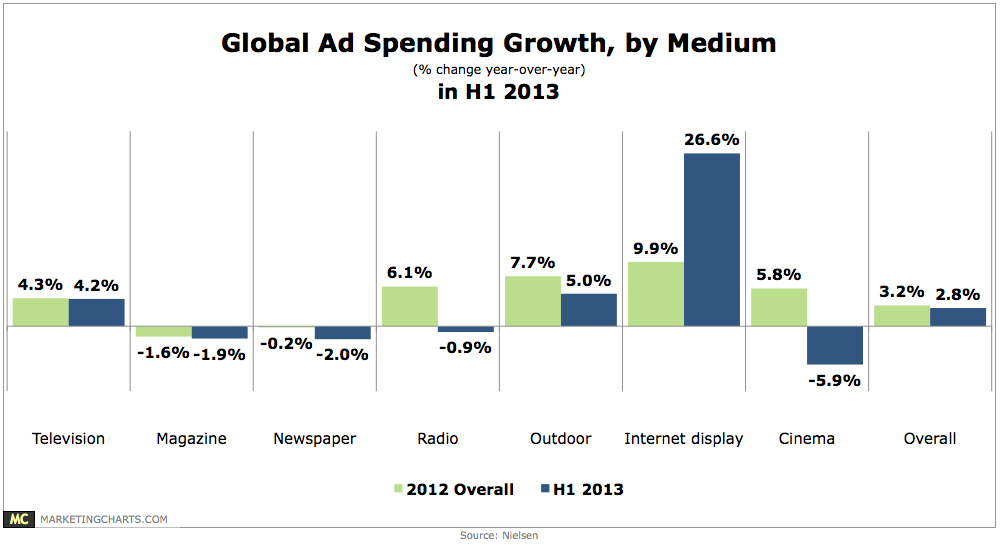
The median load time for home pages of the top 100 US retail websites has slowed yet again on a year-over-year basis.
Read MoreMobile Email Use By OS, April 2014 [CHART]
One-quarter of marketers planned to increase spending on email marketing.
Read MoreMost Effective Online Channels For Customer Retention, Q2 2014 [CHART]
86% of US digital marketers used email marketing regularly—the highest response rate out of all programs listed.
Read MoreMobile Video App Use By Age Group, July 2014 [CHART]
Not surprisingly, late Millennials (18-24) are the most likely to be using a mobile video application at least once a month.
Read MoreFacebook Active Mobile Monthly Users & Ad Revenues, Q3 2012 – Q2 2014 [CHART]
Facebook’s advertising revenues grew by 67% year-over-year in Q2 to almost $2.7 billion.
Read MoreEye Tracking Technology & Web Design [INFOGRAPHIC]
This infographic illustrates the fundamentals of how eye tracking technology can inform website design.
Read MoreUS Retail mCommerce Sales, 2012-2018 [TABLE]
Apps may be where mobile users spend most of their time—86.0% of US smartphone internet time was spent in apps in 2013.
Read MoreTrust & Relevance's Effect On Email Marketing Success, July 2014 [TABLE]
Consumers only have 4-5 brands that they always open emails from.
Read MoreCMOs Attitudes Toward Collaboration With CIOs, July 2014 [CHART]
83% of IT executives feel a need to align and interact with marketing (up from 77% in 2012) and 69% of marketing executives feel the same way about IT (up from 56% in 2012).
Read MoreCustomer Satisfaction With Social Networking Sites, 2013 vs 2014 [CHART]
Customer satisfaction with social media websites improved by 3 points year-over-year to an average score of 71 on the ACSI’s 100-point scale.
Read More