Online Behavior
US Home Entertainment Rental & Sales Revenues, 2012-2014 [TABLE]
Revenues from US subscription video-on-demand (SVOD) streaming services—such as Netflix—totaled more than $1.91 billion on in H1 2014.
Read MoreTop Mobile Apps By Age, June 2014 [TABLE]
Facebook is the top mobile application for each age group.
Read MoreB2B Marketers' Satisfaction With Data-Driven Tactics, August 2014 [CHART]
Slightly more than two-thirds of B2B marketers are using data to analyze customers.
Read MoreMarketing Agencies’ Most Effective New Business Tools, August 2014 [CHART]
Aside from referrals, Senior-level marketers most often learn about new agencies from emails (57%), industry conferences (53%) and calls (40%).
Read MoreOnline Leaders & Followers, August 2014 [TABLE]
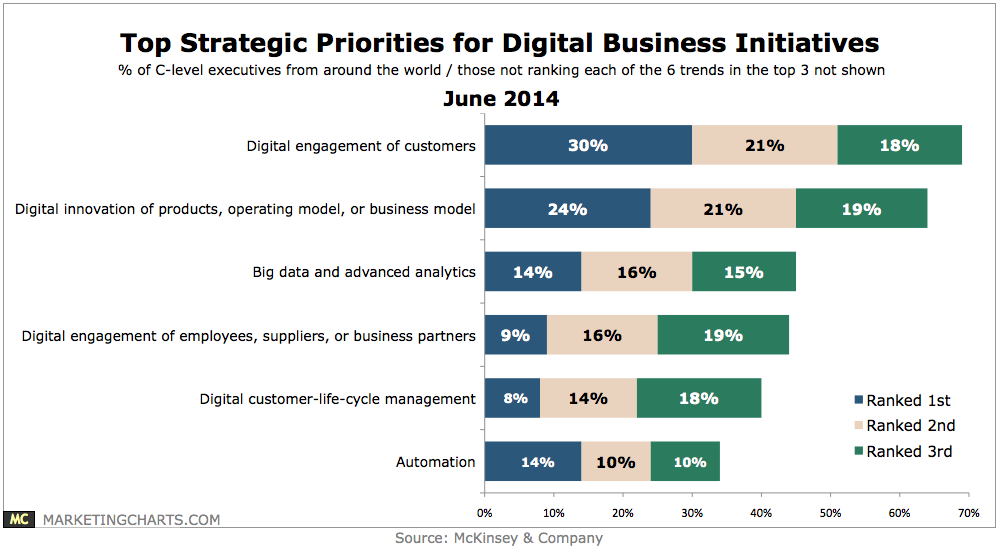
96% of executives from Global 1,000 companies say that their markets and business models are being pressured by the shift to digital,
Read MorePhablet User Persona [CHART]

Compared to the average mobile user, Phablet users over-index in the Social Influencer Persona by 2.4x.
Read MoreTime Spent On Books By Device Type, 2013 vs 2014 [CHART]
Phablet users behave a lot like consumers on smaller devices, with gaming, social and entertainment as the leading app categories.
Read MoreAndroid Users By Device Type, 2013 vs 2014 [CHART]
iOS only recently offered a Phablet, so Flurry looked through an Android-only lens to get a clearer idea of how Phablets are faring.
Read MoreMobile App Sessions By Device Type, 2013 vs 2014 [CHART]
Phablets command a disproportionate share of app activity.
Read MoreActive Mobile Use By Device Type, 2013 vs 2014 [CHART]
Over the course of a year, the installed base for Phablets doubled.
Read More