Online Behavior
Digital Marketing Reassessment [INFOGRAPHIC]
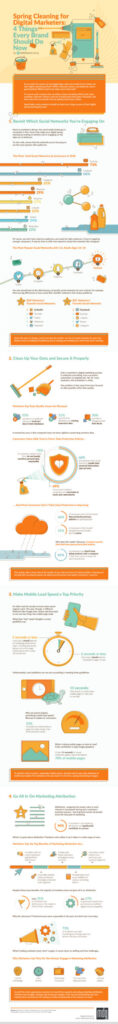
This infographic recommends four steps brands should take to reassess their digital marketing during their digital spring cleaning.
Read MoreTop Social Video Platforms [VIDEO]
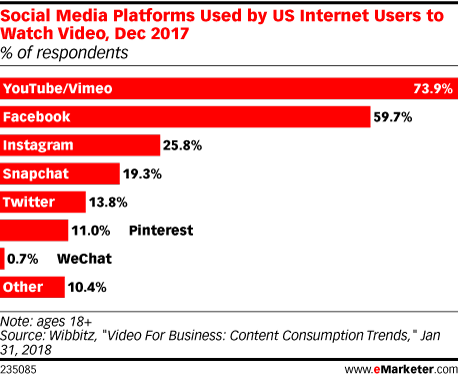
New research from artificial intelligence-powered video creation service Wibbitz provides some insight into which social media platforms video advertisers should be paying attention to—and it’s pretty much what you would expect.
Read MoreStreaming Video By Age Group, 2015-2017 [CHART]
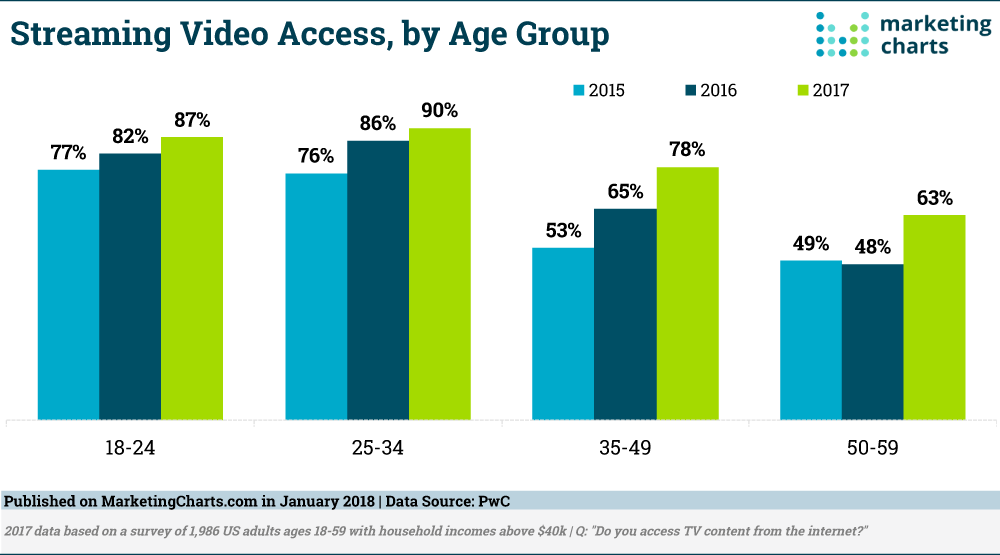
Streaming video has been popular with Millennials for some time, but it’s middle-aged Americans who are now getting in on the act. Almost 8 in 10 adults ages 35-49 accessed TV content from the internet in 2017, up from 53% just a couple of years earlier.
Read MoreWhat Smart Speaker Owners Would Like From Brands [CHART]
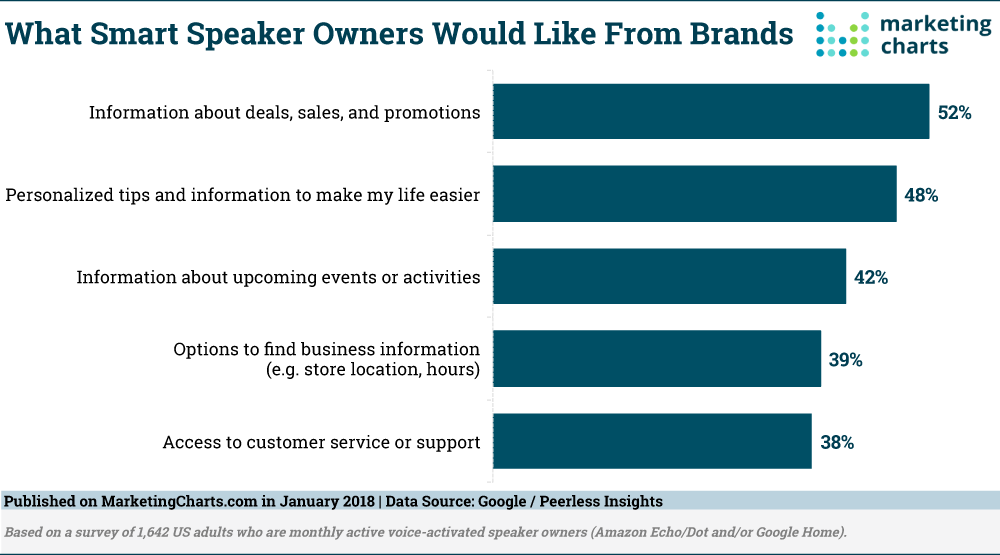
More than one-quarter of Alexa owners have asked their device about deals, recent research has revealed. Now, new data from Google and Peerless Insights indicates that Smart Speaker owners are most interested in receiving information about deals, sales and promotions from brands.
Read MoreWeb Survey Response Rates [CHART]
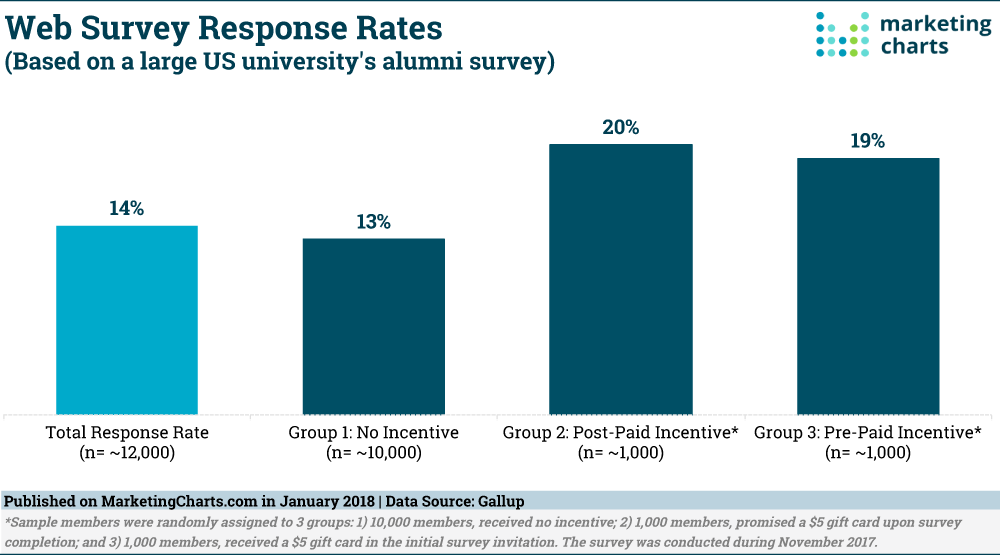
Garnering survey responses can be a notoriously challenging task, facing headwinds such as general dissatisfaction with market research and survey fatigue. Consider that telephone survey response rates plummeted from 36% in 1997 to just 9% in 2012.
Read MoreAmericans' Internet Access By Type, 2012 vs 2017
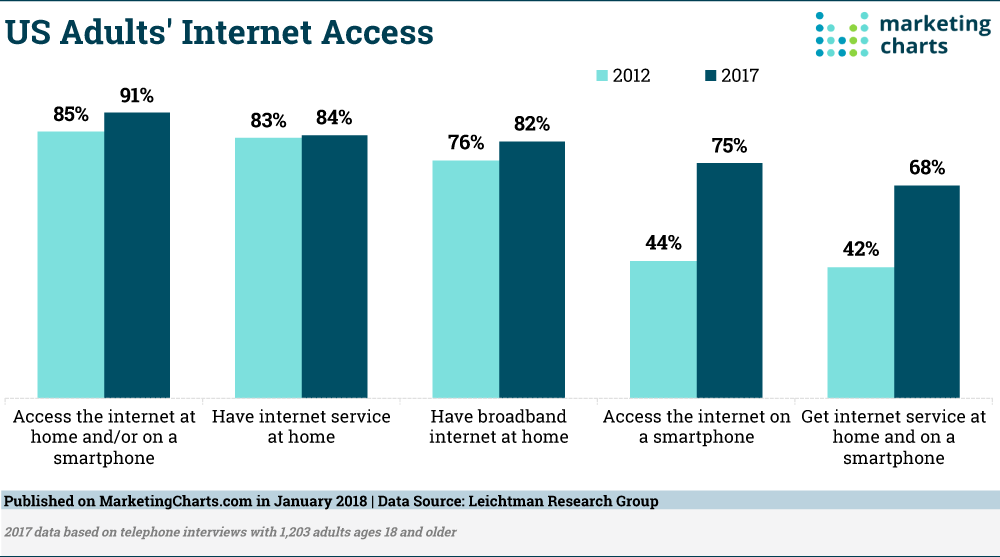
Fully 84% of US households now get some type of internet service at home, up 10% points over the past decade, according to a Leichtman Research Group (LRG) study. While internet service usage is only up a point over the past 5 years, the type of service used is changing.
Read MoreInstagram User Penetration, 2016-2021 [CHART]
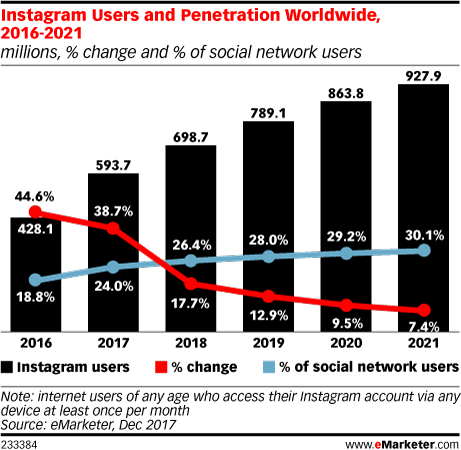
One in three people—2.48 billion—worldwide used a social network in 2017, eMarketer estimates. Rising social network use in emerging markets in Asia-Pacific, Latin America and the Middle East and Africa drove an 8.7% gain over 2016.
Read MoreVoice Activated Digital Assistant Users By Generation [CHART]
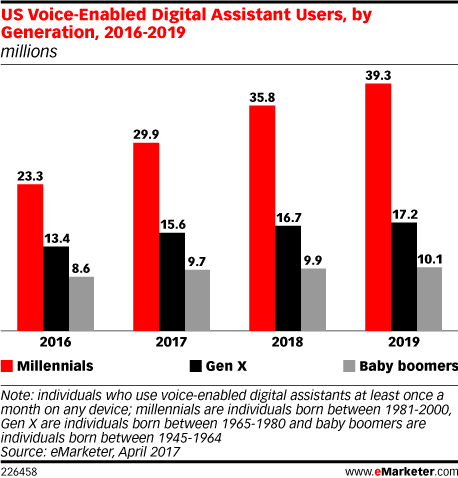
And users of such services are expected to skew young. This year, for example, nearly half of voice-enabled digital assistant users will be millennials, eMarketer estimates.
Read MoreConsumer Openness To Smart Speaker Audio Ads [CHART]
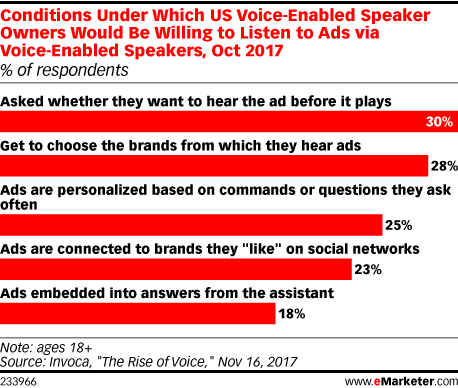
Three in 10 said they would entertain ads via voice assistants if they were simply asked if they wanted to hear one before it played. In addition, 28% were open to ads if they got to choose the brands doing the advertising.
Read MoreUS Smartwatch Users, 2016-2021 [CHART]
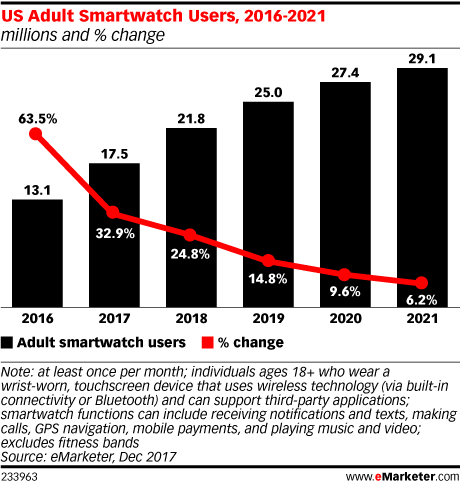
In its first breakout of smartwatch users, eMarketer projects the number of US adult smartwatch users will reach 21.8 million in 2018, up 24.8% over 2017.
Read More