Online Behavior
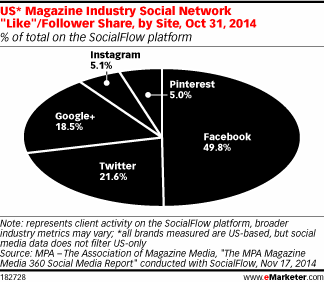
Magazine Industry Social Media Like/Follower Share By Network, October 2014 [CHART]
Facebook’s share of Likes and Followers worldwide of US magazine brands on social networks was nearly 50%.
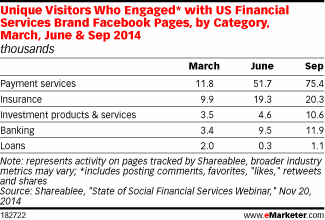
Read MoreUnique Visitors To Financial Services Facebook Pages, June & September, 2014 [TABLE]
Payment services maintained the highest number of monthly unique engaged visitors during the six months as the total more than sextupled.
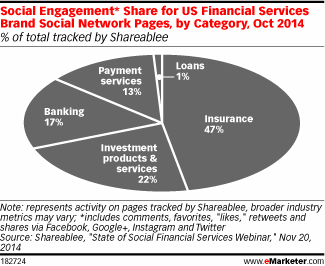
Read MoreShare Of Social Engagement On Financial Service Brand Pages, October 2014 [CHART]
Nearly three-quarters (72%) of US financial services brands tracked on the Sharablee social analytics company’s platform had a social network presence.
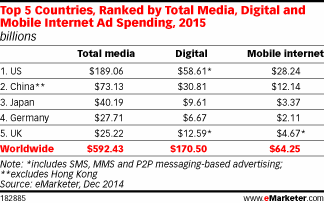
Read MoreTop 5 Countries In Ad Spending, 2015 [TABLE]
Around the world, advertisers will spend $592.43 billion in 2015, an increase of 6.0% over 2014.
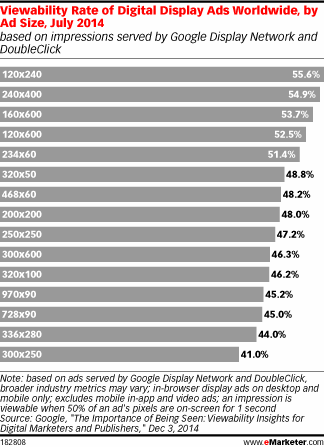
Read MoreDisplay Ad Viewability Rates By Ad Size, July 2014 [CHART]
Vertical ad units were consistently the most viewable. Worldwide, 120×240 placements performed the best for viewability, with a rate of 55.6%.
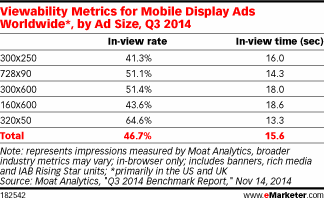
Read MoreMobile Display Ad Viewability Metrics By Ad Size, Q3 2014 [TABLE]
Screenwide display ads on mobile were tops for viewability.
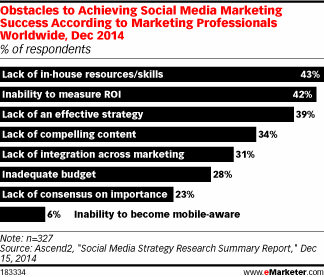
Read MoreObstacles To Social Media Marketing Success, December 2014 [CHART]
Fully 43% of marketers said that a lack of in-house resources and skills was an obstacle to achieving social media marketing success.
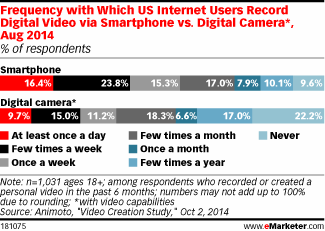
Read MoreFrequency Of Video Recording By Smart Phone & Digital Camera, August 2014 [CHART]
Web users were using smartphones much more frequently than digital cameras for video recording.
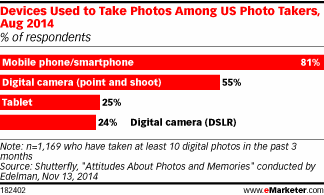
Read MoreDevices People Use To Take Photos, August 2014 [CHART]
The majority of US consumers now use smartphones—eMarketer estimates that penetration will reach 51.8% this year.
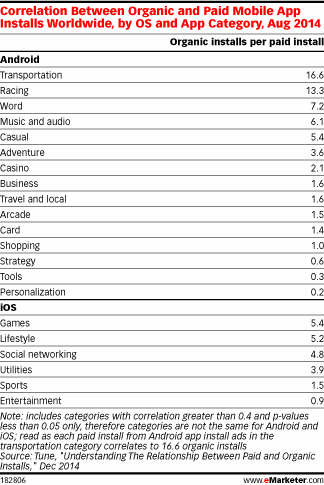
Read MoreCorrelation Between Organic & Paid Mobile App Installs, August 2014 [TABLE]
In most app categories, there is a correlation between paid app installs and organic distribution of the same apps.
Read More