Online Behavior
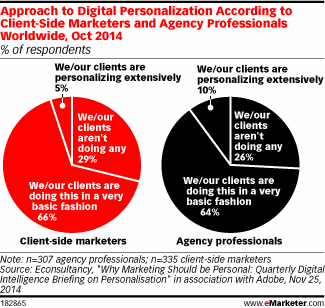
Marketers' Approach To Personalization, October 2014 [CHART]
Just 5% of client-side marketers worldwide said they were personalizing extensively, and 10% of agency professionals said the same about their clients.
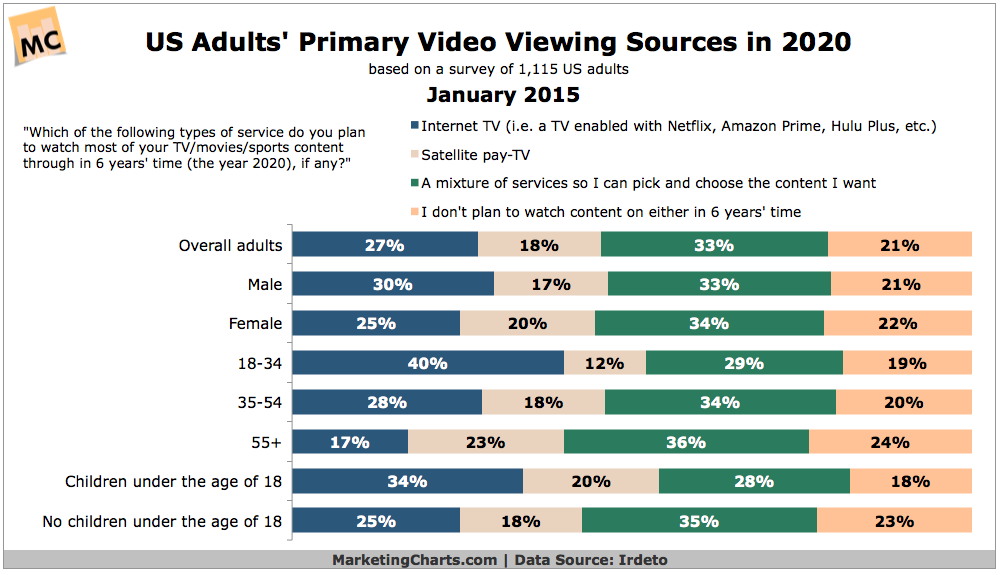
Read MoreAmericans' Primary Video Viewing Sources In 2020 [CHART]
27% of Americans cited internet TV (a TV enabled with Netflix, Amazon Prime, Hulu Plus, etc.) as their primary video viewing source during the next 6 years.
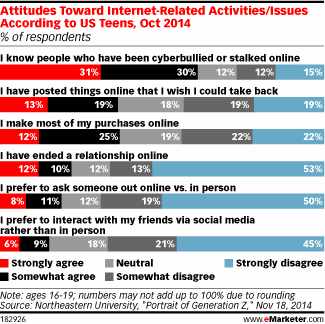
Read MoreTeen Attitudes Toward Select Online Activities, October 2014 [CHART]
Some 81% of internet users between the ages of 13 and 22 feel their peers share too much online.
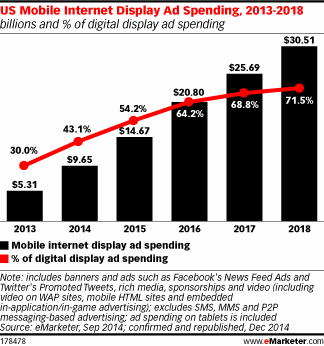
Read MoreUS Mobile Display Ad Spending, 2013-2018 [CHART]
On the whole, cost-per-thousand (CPM) averages in 2014 were on par or above 2013 rates.
Read MoreMobile App YoY Usage Growth in 2014 [CHART]
Mobile application usage – defined as a user opening an app and recording a session – increased by 76% year-over-year.
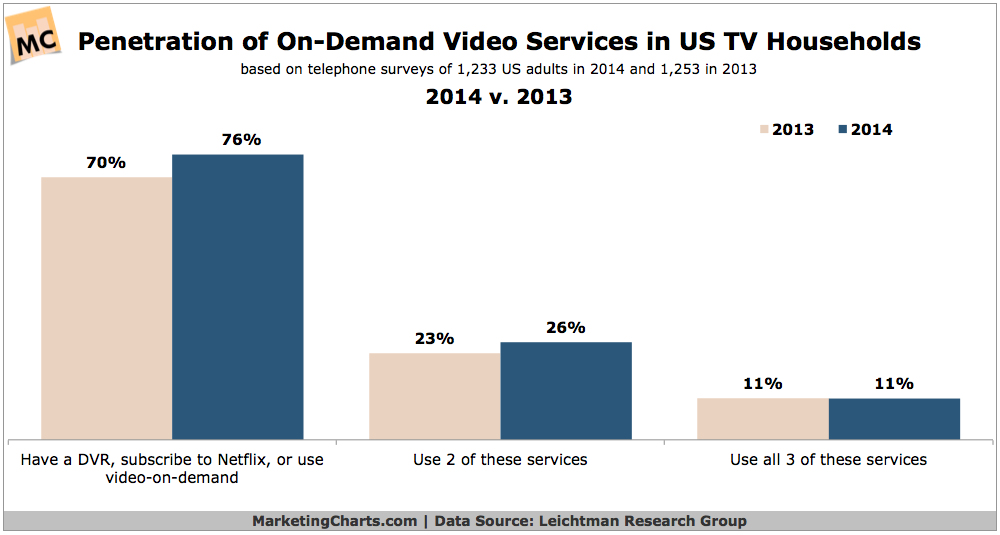
Read MorePenetration Of On-Demand Video Services, 2013 vs 2014 [CHART]
3 in 4 TV households in the US now have a DVR, subscribe to Netflix, or use video-on-demand (VOD) services from a cable or telco provider.
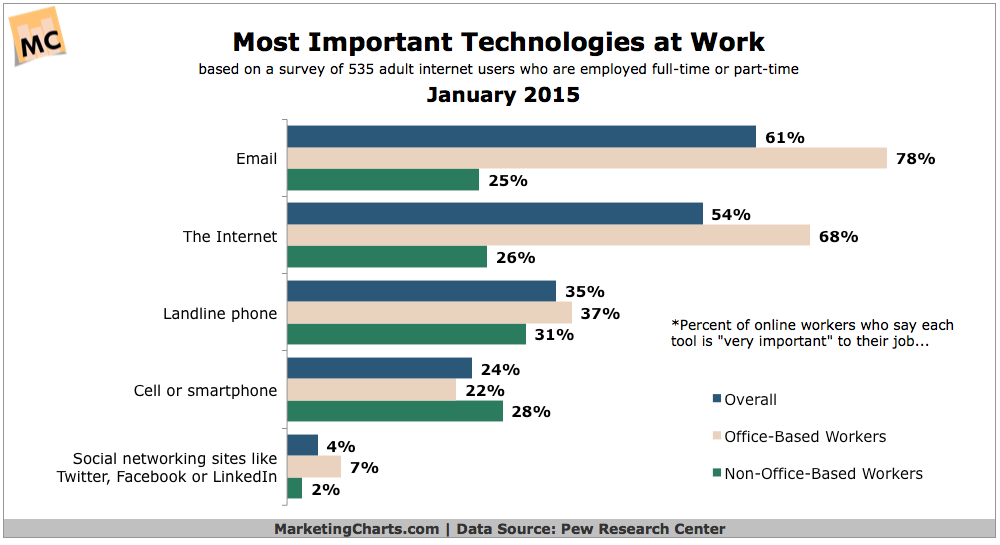
Read MoreTop Work Technologies, January 2015 [CHART]
Email (61%) beats the internet (54%) and landline phones (35%) as the most important technology for working internet users.
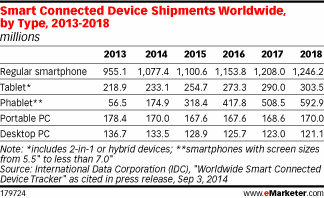
Read MoreGlobal Smart Device Shipments By Type, 2013-2018 [TABLE]
The number of global shipments of phablets are expected to pass tablets shipped worldwide in 2015 for the first time.
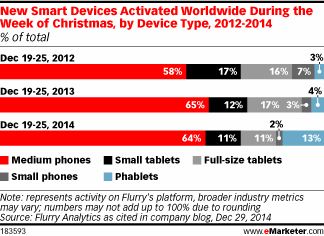
Read MoreNew Smart Devices Activated Christmas Week By Type, 2012-2014 [CHART]
Phablet devices activated worldwide during the week of Christmas accounted for 13% of total activations—up 225% year over year.
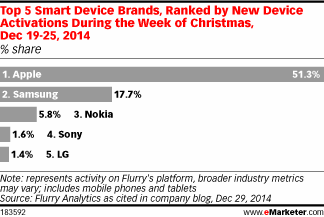
Read MoreTop 5 Smart Device Brands Activated During Christmas Week, 2014 [CHART]
Apple accounted for 51.3% of device activations between December 19 and 25, 2014.
Read More