Newspaper Advertising
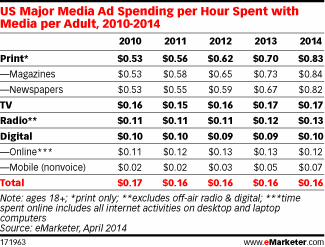
US Major Media Ad Spending Per Hour Spent With Media, 2010-2014 [TABLE]
Print still commands the most ad dollars—despite the fact that it’s losing in terms of absolute time spent with media at double-digit rates each year since at least 2011.
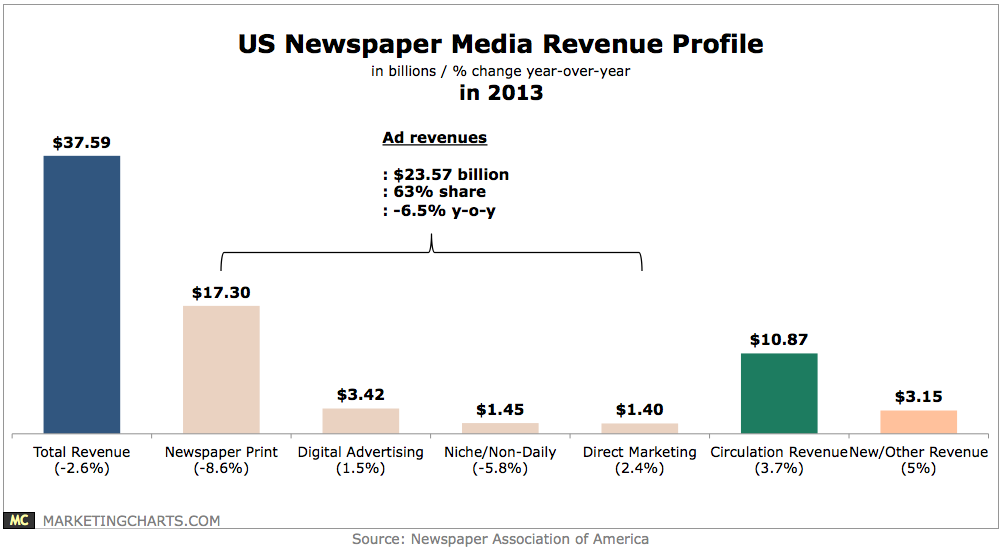
Read More2013 US Newspaper Revenues [CHART]
US newspaper cross-platform media revenues shrank by 2.6% year-over-year in 2013 to $37.6 billion.
Read MoreIgnored Ad Types By Age & Gender, January 2014 [TABLE]
The majority of male and female millennials said they ignored online banner ads, and around two in five males and half of females didn’t pay attention to social media or search engine ads.
Read MoreTop Contributors To Global Ad Spending Growth, 2013-2016 [CHART]
Mobile will be the prime contributor of new ad spending (accounting for 35% of it), and will grow to account for 7.6% of total ad spend in 2016.
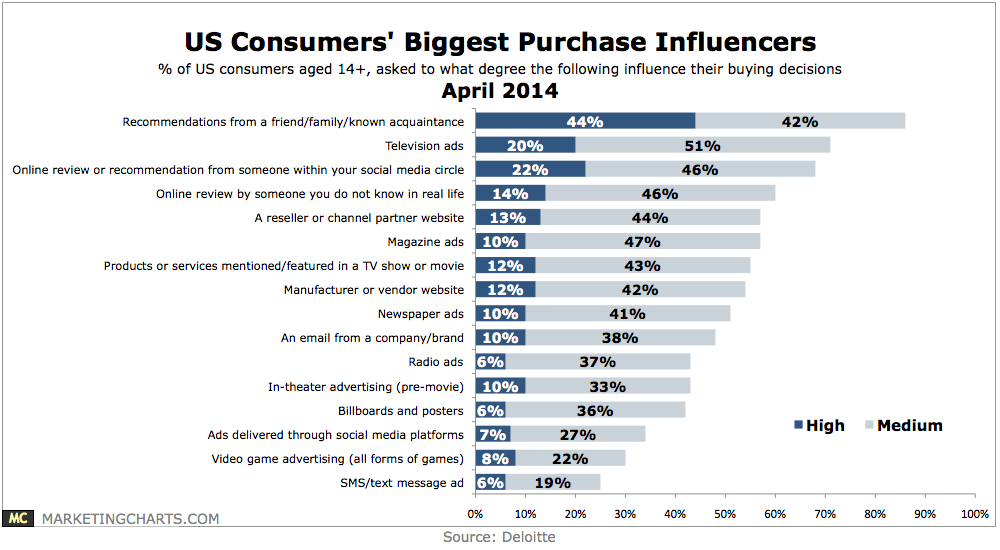
Read MoreUS Consumers’ Biggest Purchase Influencers, April 2014 [CHART]
Word-of-mouth emerges as most influential, with TV ads leading the way among paid media.
Read MoreChange In Measured Ad Spend By Medium, 2012 vs 2013 [CHART]
Overall, TV media spend was basically flat (-0.1%) from 2012, as an off-year for P&O spending was offset by increased ad spending on sports.
Read MoreUS Media Ad Spending Share By Media, 2012-2018 [CHART]
TV will remain the dominant advertising channel, making up 38.1% of total media spending in 2014.
Read MoreAuto Ads That Prompted Consumer Research, May 2013 [CHART]
At the start of the purchase path, mobile, tablet and video ads each laid claim to prompting 34% of buyers to start researching vehicles,
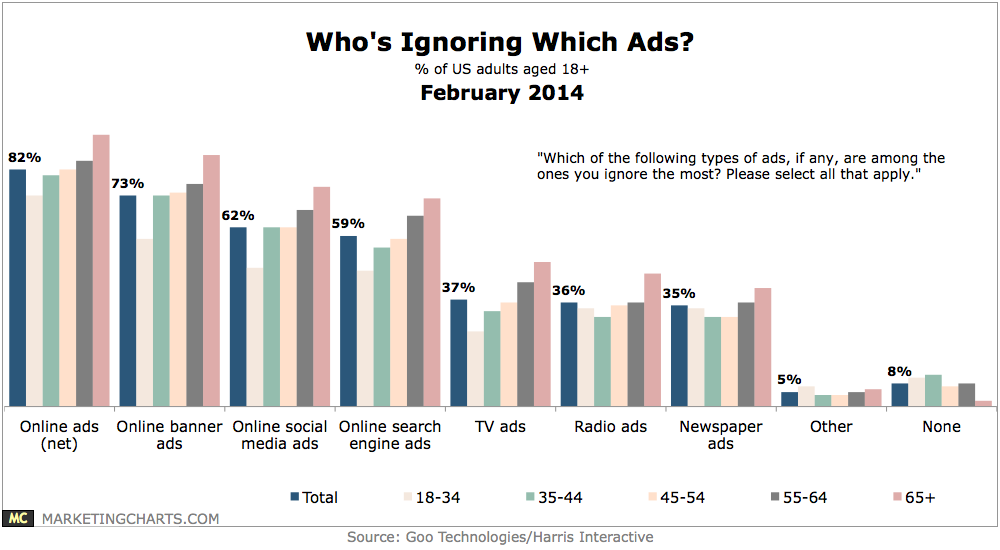
Read MoreAds People Most Ignore, February 2014 [CHART]
Online ads are ignored by the largest share of respondents (82%), with traditional media ads such as TV ads (37%), radio ads (36%), and newspaper ads (35%) a fair way behind.
Read MoreGlobal Ad Spending Growth By Medium, Q1-Q3 2013 [CHART]
Global ad spending across major media grew by 3.2% year-over-year during the third quarter of 2013.
Read More


