Native Advertising
American Publishers Who Offer Native Advertising, June 2014 [CHART]
US native ad spending came in at $1.3 billion in 2013 and expected this to rise drastically through 2018, when it would reach $9.4 billion.
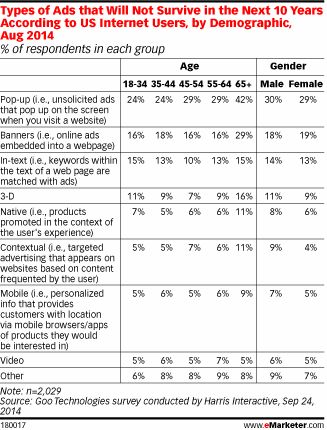
Read MoreTypes Of Ads Consumers Believe Will Disappear In 10 Years, August 2014 [TABLE]
29% of US internet users thought pop-up ads wouldn’t survive the next 10 years.
Read MoreTop Channels Marketers Use To Distribute Content, June 2014 [CHART]
Four in five marketing professionals cited social sharing as a distribution channel used for content marketing.
Read MoreObstacles To Native Advertising Success, June 2014 [CHART]
Market demand is the biggest obstacle to increased business in native advertising, according to half of premium publishers recently surveyed by Polar.
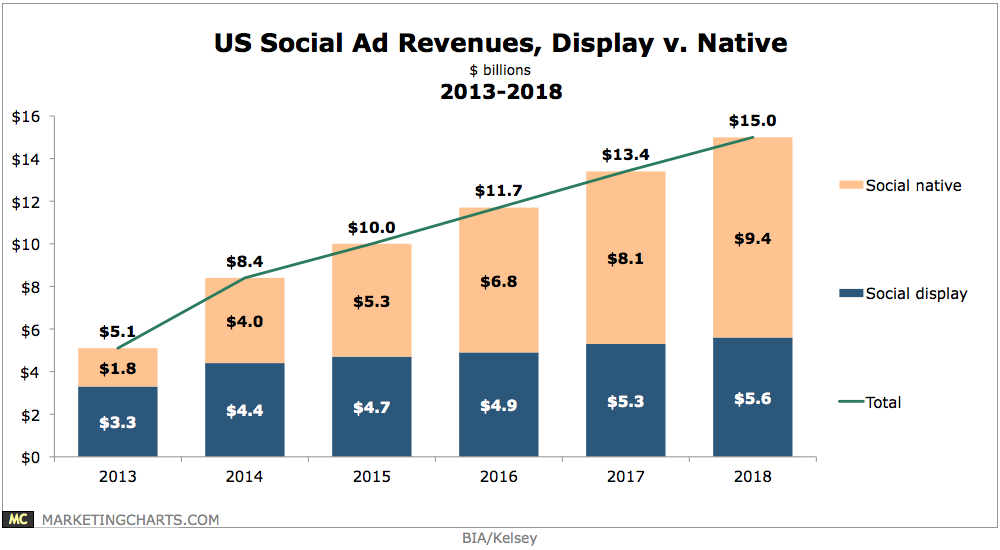
Read MoreUS Social Ad Revenues – Display vs Native, 2013-2018 [CHART]
Native social ads are expected to overtake social display ads in revenue next year.
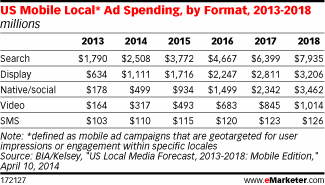
Read MoreUS Mobile Local Ad Spending By Format, 2013-2018 [TABLE]
Search and social were among the top among formats, with search claiming the majority of location-targeted mobile ad spending through 2018.
Read MoreState Of Native Advertising, 2014 [INFOGRAPHIC]
Copyblogger solicited 2,088 people for their opinions on native advertising for this infographic.
Read MoreTop Marketing Objectives For Native Mobile Ads, August 2013 [CHART]
Awareness was the top marketing objective for native mobile ads among US digital marketing professionals.
Read MoreUS Social Media Ad Spending By Type, 2012-2017 [TABLE]
Native ad spending on social media alone is estimated to grow from $3.1 billion this year to $5.0 billion in 2017.
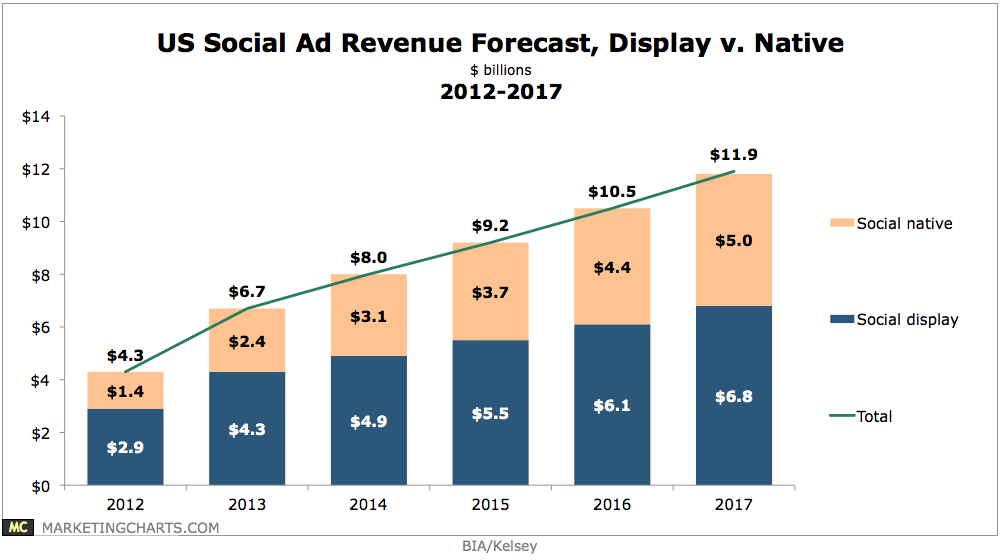
Read MoreUS Social Ad Revenue Forecast, Display vs Native 2012-2017 [CHART]
Native social ad revenues – primarily driven by Facebook’s Sponsored Stories and Twitter’s Promoted Tweets – will reach $5 billion in 2017, up from roughly $4.6 billion in the previous forecast.
Read More