Mobile Marketing
Mobile Users' In-Store Activities, February 2015 [CHART]
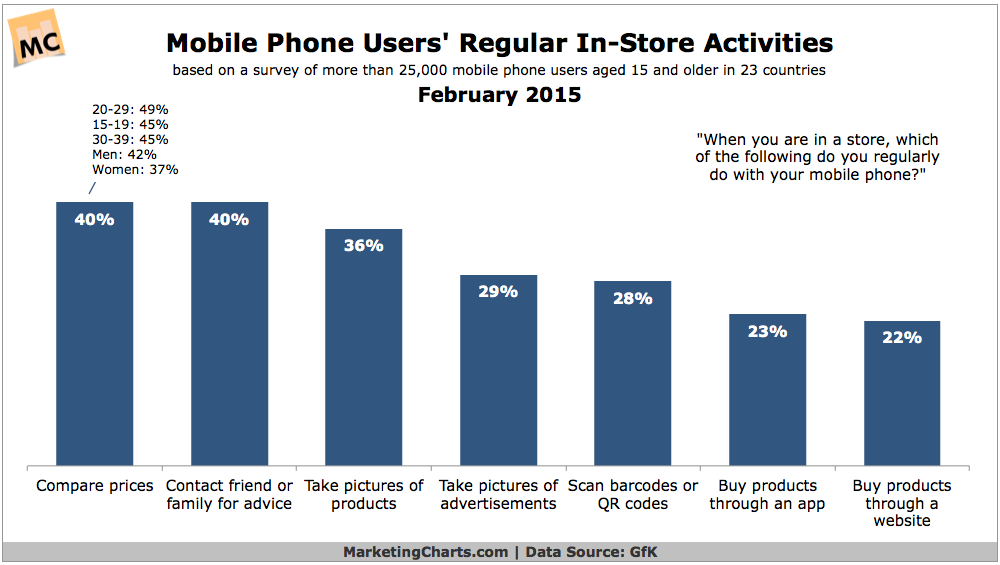
40% of mobile phone users surveyed across 23 countries claim to regularly compare prices while in-store.
Read MoreUS Text Messaging Revenues, 2014-2018 [CHART]
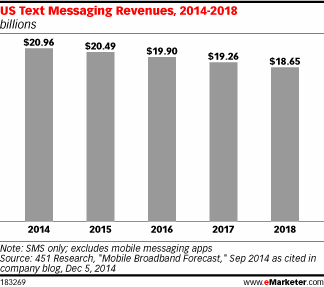
Last year, SMS traffic fell 2.0% globally year over year, hitting 7.475 trillion. North America saw the biggest drop, falling 5.4% last year.
Read MoreGlobal Text Message Traffic By Region, 2004-2014 [TABLE]
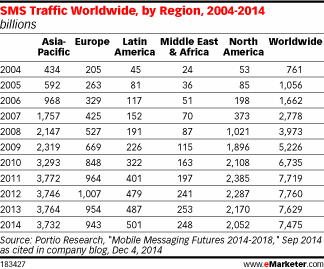
Text messaging is losing its share of the action thanks to the rise of over-the-top (OTT) mobile messaging services such as WeChat.
Read MoreCost Per Minute Viewed Of Video Ads, 2014 [TABLE]
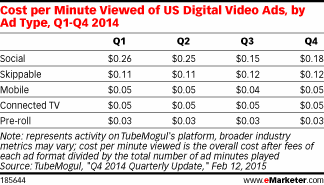
The average weekly cost per minute viewed for pre-roll ads was 3.2 cents in Q4 2014—the lowest price.
Read MorePreferred Platforms For Mobile App Development, November 2014 [CHART]
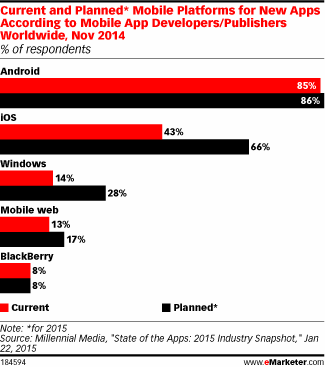
While Android remained the most-used platform, iOS was expected to see a big jump in app development.
Read MoreMobile App Monetization Models, 2013 vs 2014 [CHART]
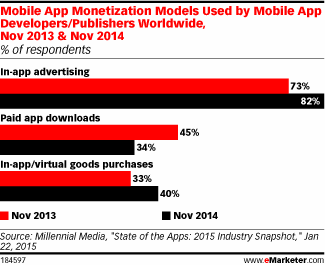
In-app advertising models grew in popularity between November 2013 and November 2014.
Read MoreAverage Monthly Mobile App Opens, 2012-2014 [TABLE]
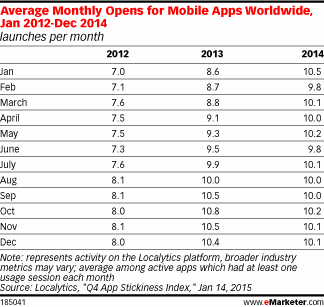
Nearly 93% of US smartphone users and over 90% of tablet users will install at least one mobile app on such devices this year.
Read MoreTop Brands For Customer Loyalty, February 2015 [TABLE]
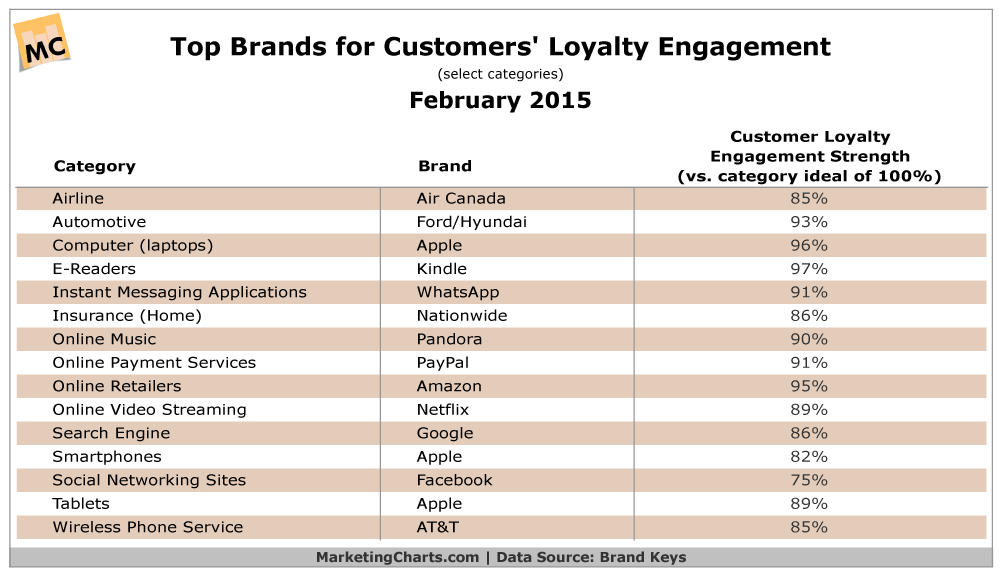
Consumers’ emotional expectations from brands continue to grow but brands are failing to keep pace.
Read MoreUs Mobile App Buyers By Device, 2013-2018 [TABLE]
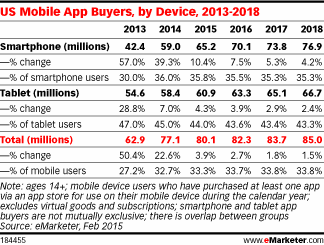
80.1 million US consumers will pay for mobile apps at least once this year, representing only 33.3% of all mobile users.
Read MoreUS Mobile Ad Spending, Local vs National, 2014-2019 [CHART]
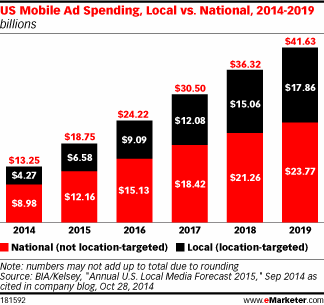
US local ad spending via mobile is expected to soar more than 54% in 2015, from $4.27 billion to $6.58 billion.
Read More