Mobile Marketing
Intended 2012 London Olympics Media Consumption [CHART]
Research from Deloitte indicates that between 15% and 26% of internet users in France, Germany, the UK and US will watch at least some of the games on a PC or tablet—and in Germany, nearly half will watch via the mobile web.
Read MoreTime Spent With Mobile Apps By App Ranking
Overall, the top 50 apps ate up 58% of US users’ app time, Nielsen determined.
Read MoreTime Spend With Mobile Apps vs Mobile Web [CHART]
According to Nielsen, US Android and iOS app users spent 101 billion minutes per month with their apps in March 2012, more than double the amount from a year earlier.
Read MoreSocial Media Personas [INFOGRAPHIC]
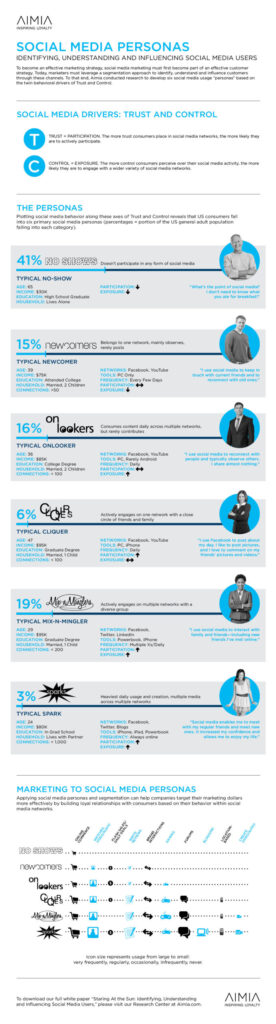
Amia research created this infographic of six different social media personas.
Read MoreRetailers' Multichannel Services [CHART]
Retailers in North America are getting the hint and making store pickup programs a relatively high priority.
Read MoreAmerican TV & Online Video Viewers By Device [CHART]
Despite the growing use of second- and third-screen devices, TVs remain the dominant way that people get their video fix.
Read MoreDevices Used To Watch TV & Online Video [CHART]
91.7% of consumers have watched video content on another device besides a television.
Read MoreBest Tweeting Days By Industry [TABLE]
Although only 19% of brand tweets are published on weekends, these tweets show engagement rates that are 17% higher than weekdays, according to a June 2012 Buddy Media report.
Read More